

Answered step by step
Verified Expert Solution
Question
1 Approved Answer
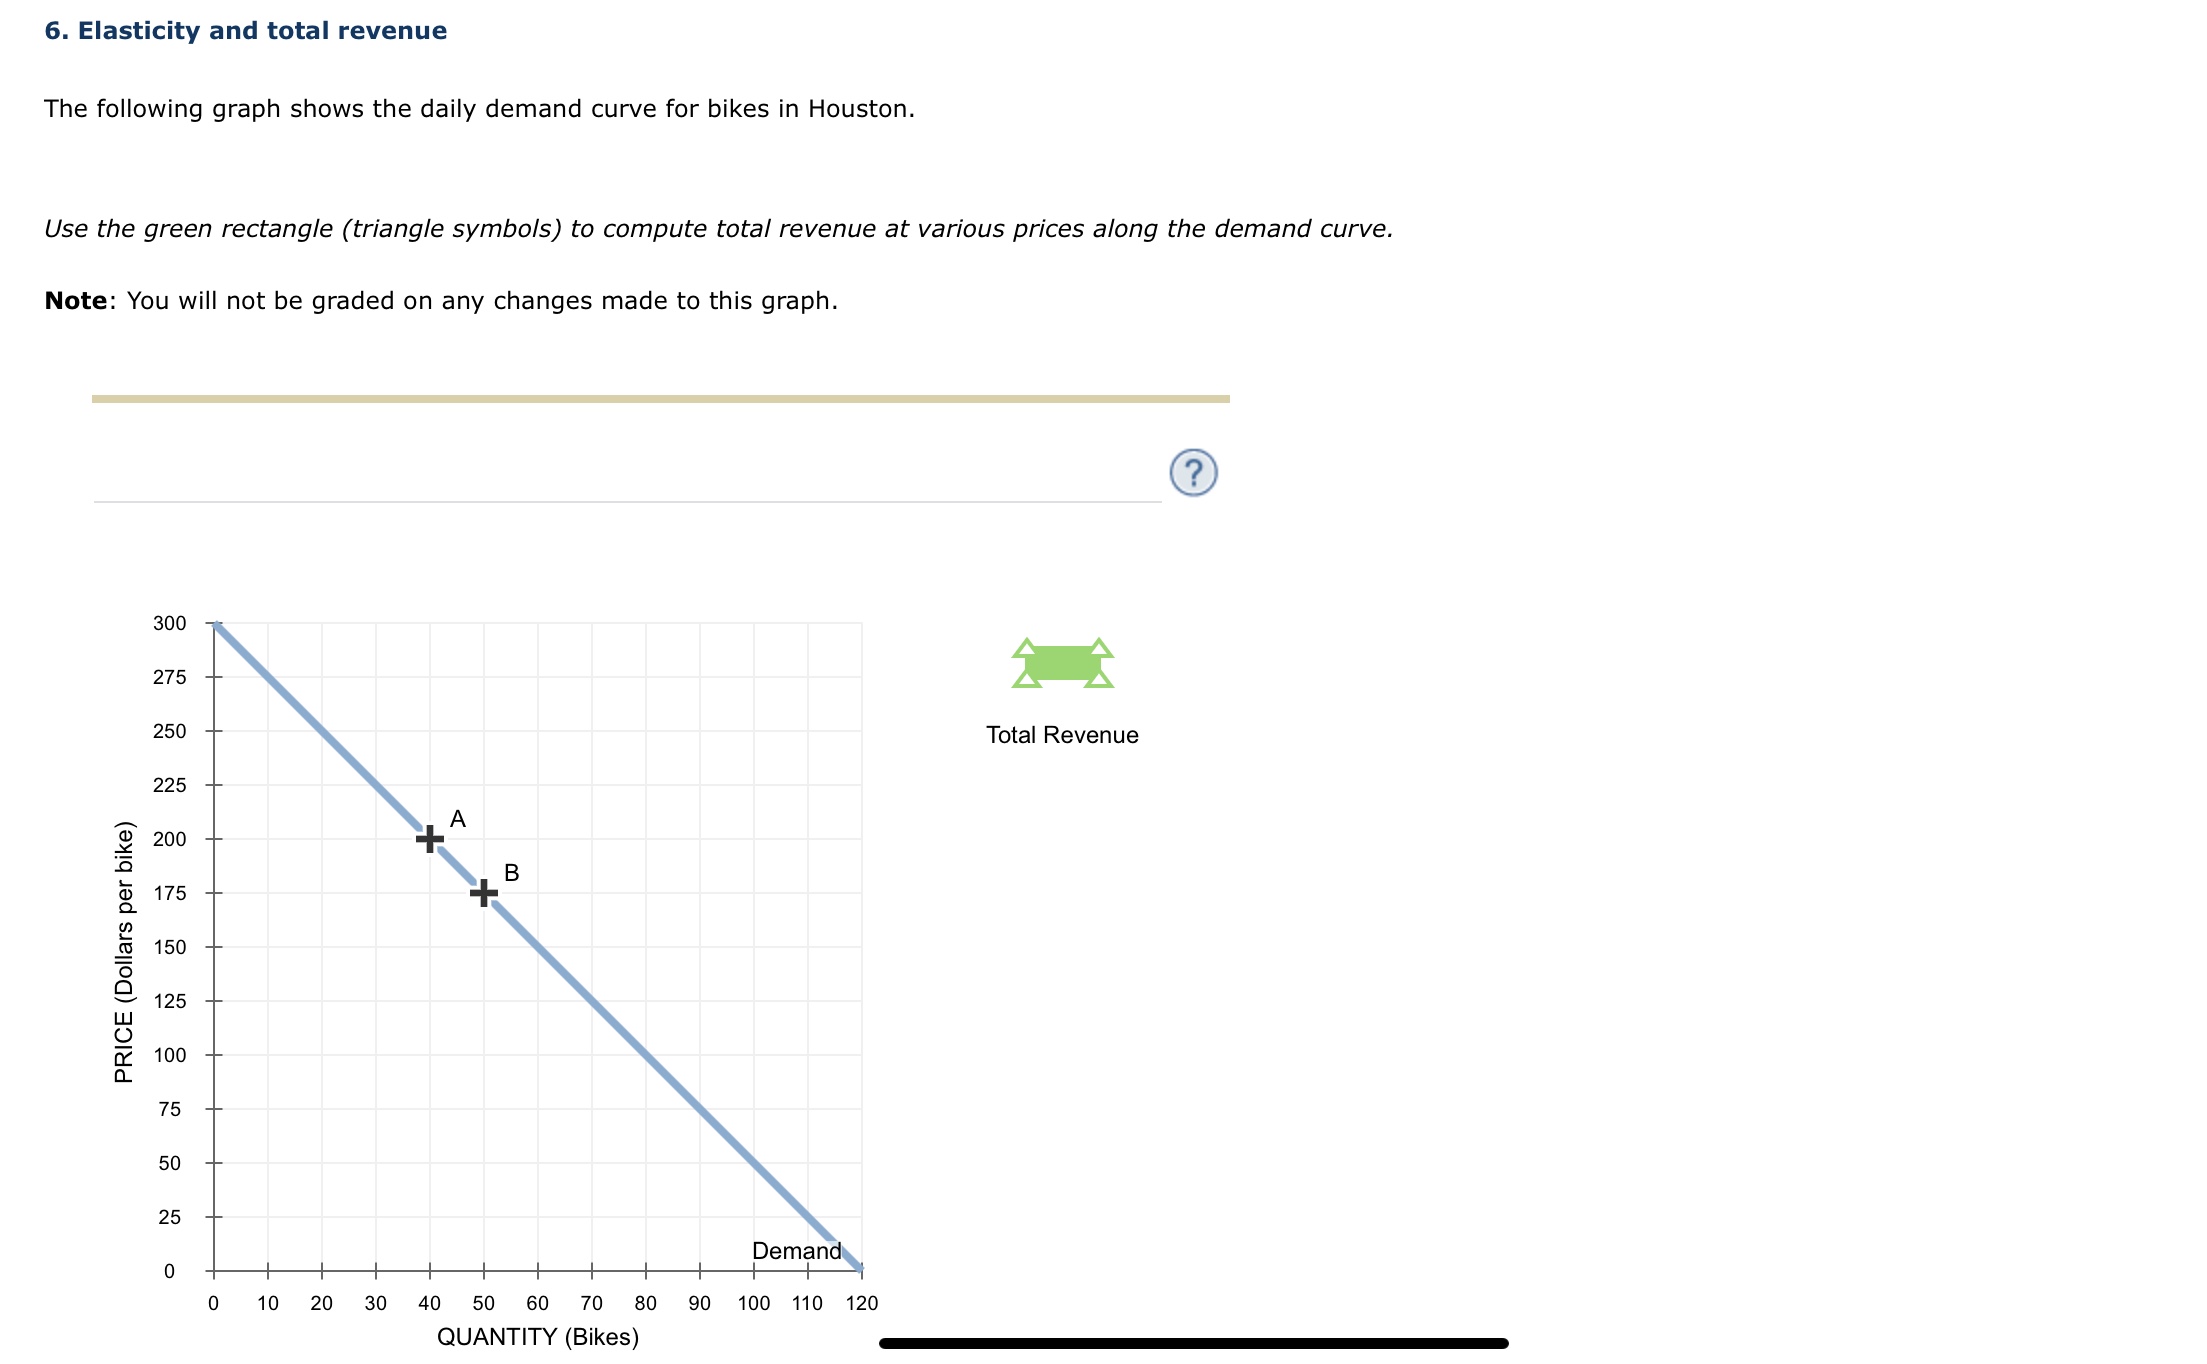
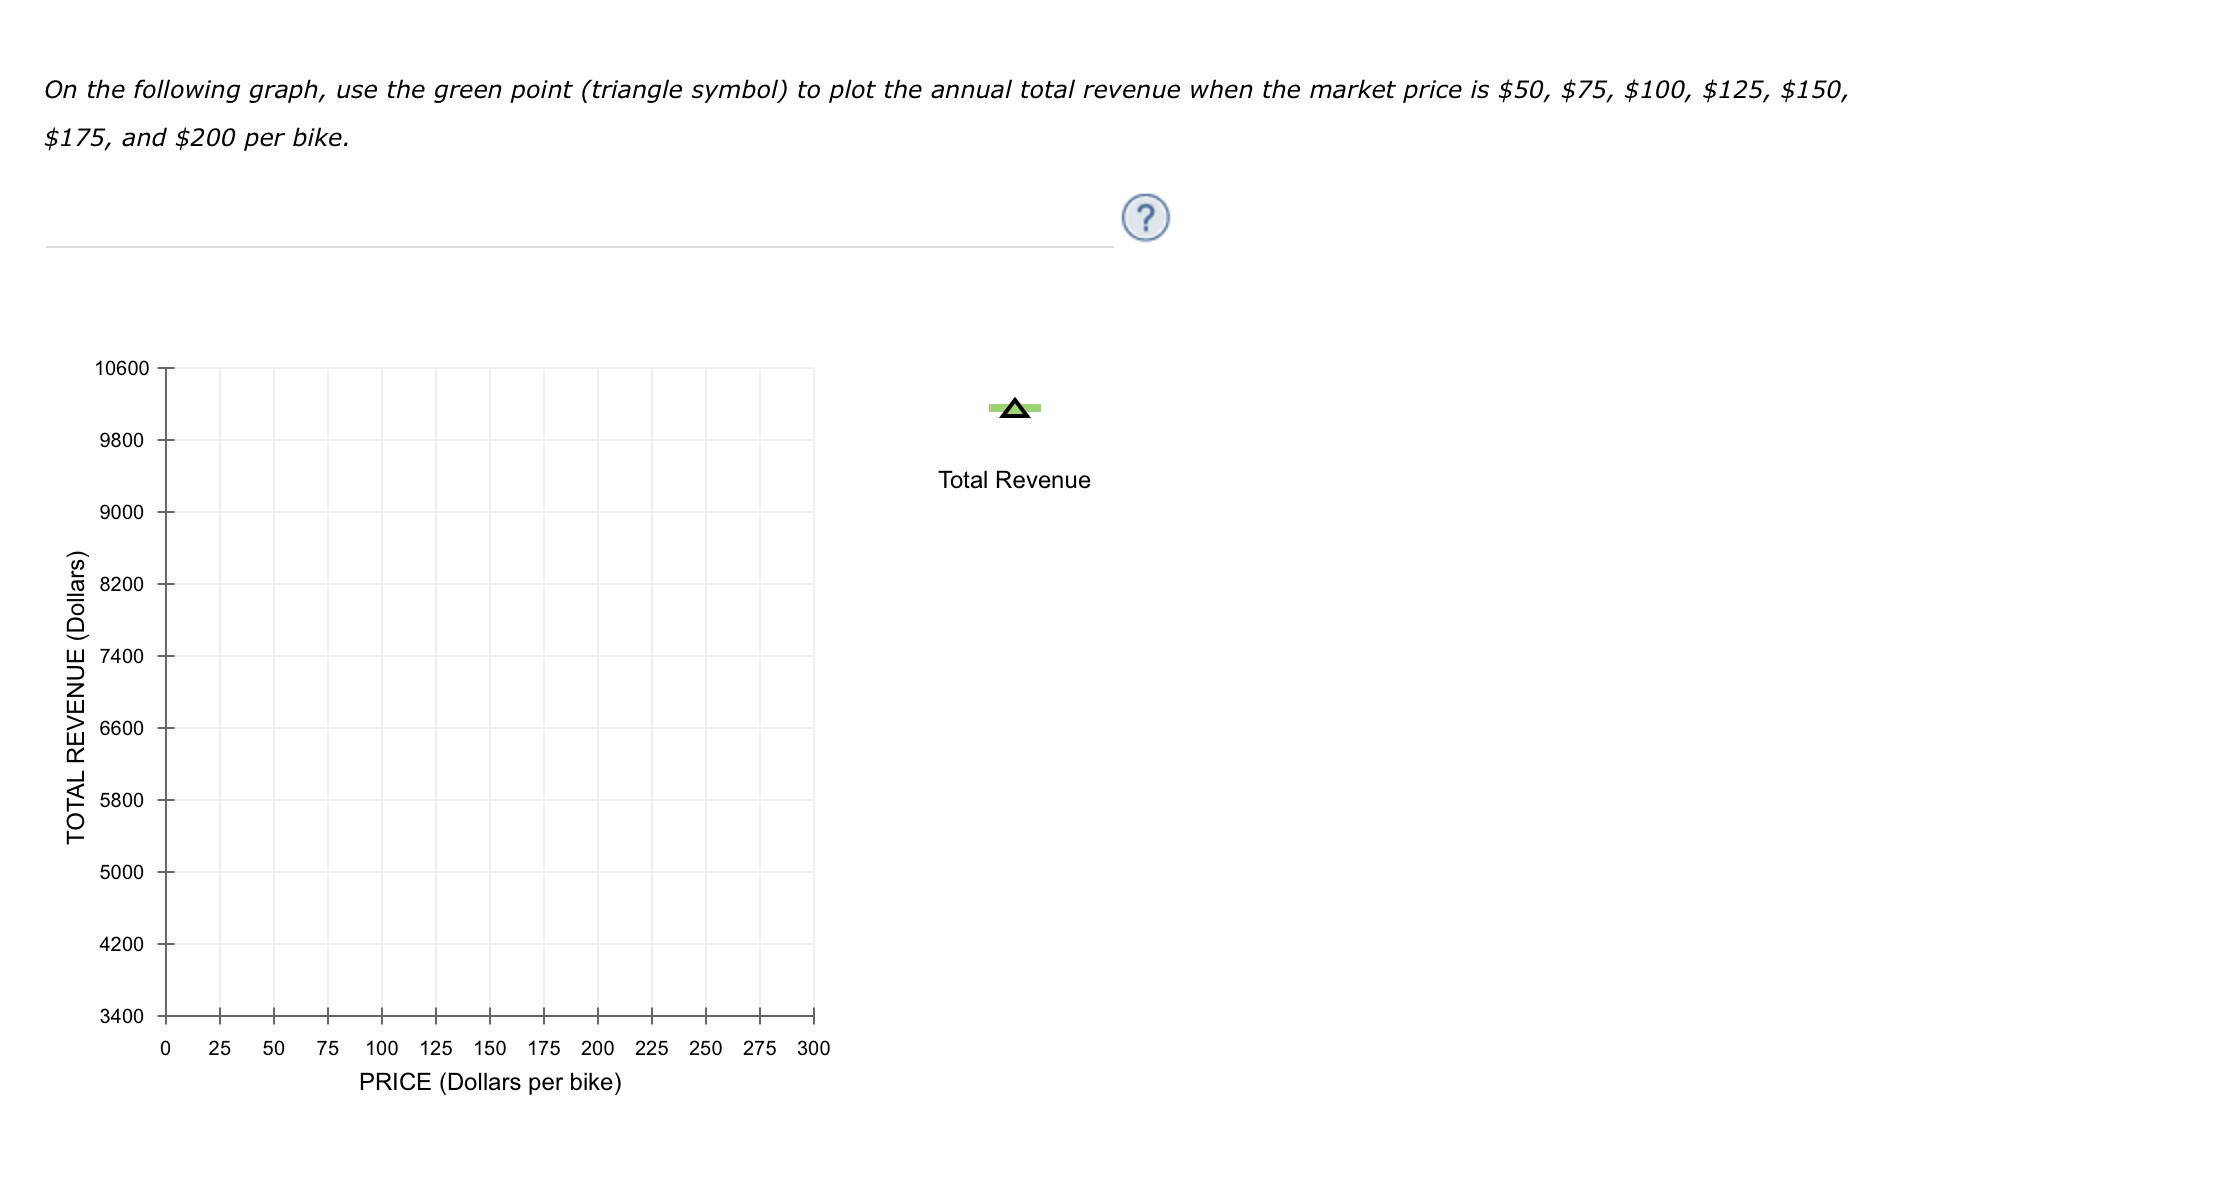
6. Elasticity and total revenue The following graph shows the daily demand curve for bikes in Houston. Use the green rectangle (triangle symbols) to compute
Step by Step Solution
There are 3 Steps involved in it
Step: 1

Get Instant Access to Expert-Tailored Solutions
See step-by-step solutions with expert insights and AI powered tools for academic success
Step: 2

Step: 3
Ace Your Homework with AI
Get the answers you need in no time with our AI-driven, step-by-step assistance
Get Started
Macroeconomics Principles and Applications
Authors: Robert e. hall, marc Lieberman
5th edition
1111397465, 9781439038970, 1439038988, 978-1111397463, 143903897X, 9781439038987, 978-1133265238