Answered step by step
Verified Expert Solution
Question
1 Approved Answer
6 es Required information [The following information applies to the questions displayed below] Simon Company's year-end balance sheets follow. At December 31 Assets Cash Accounts
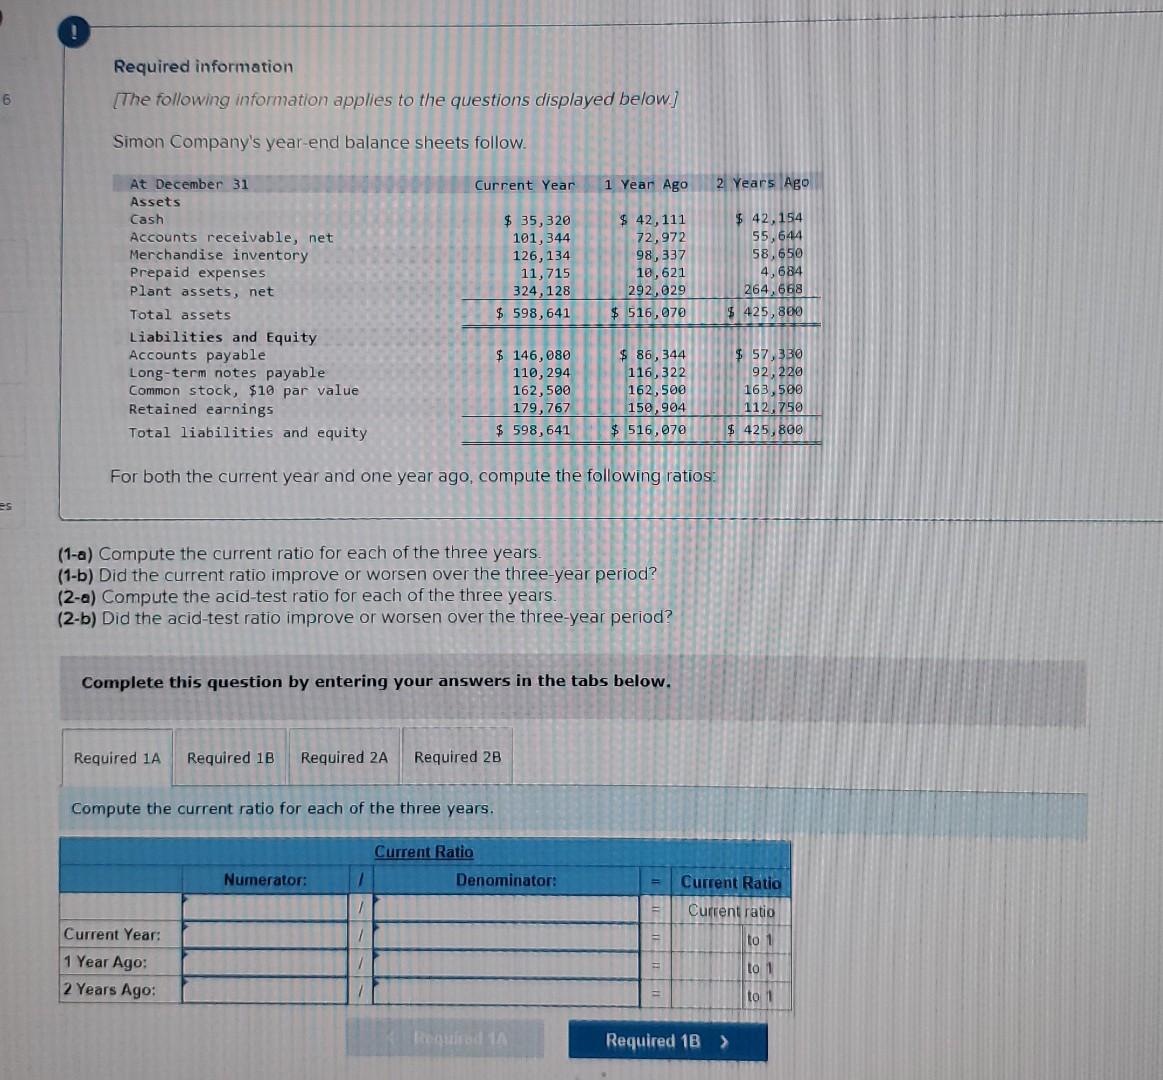
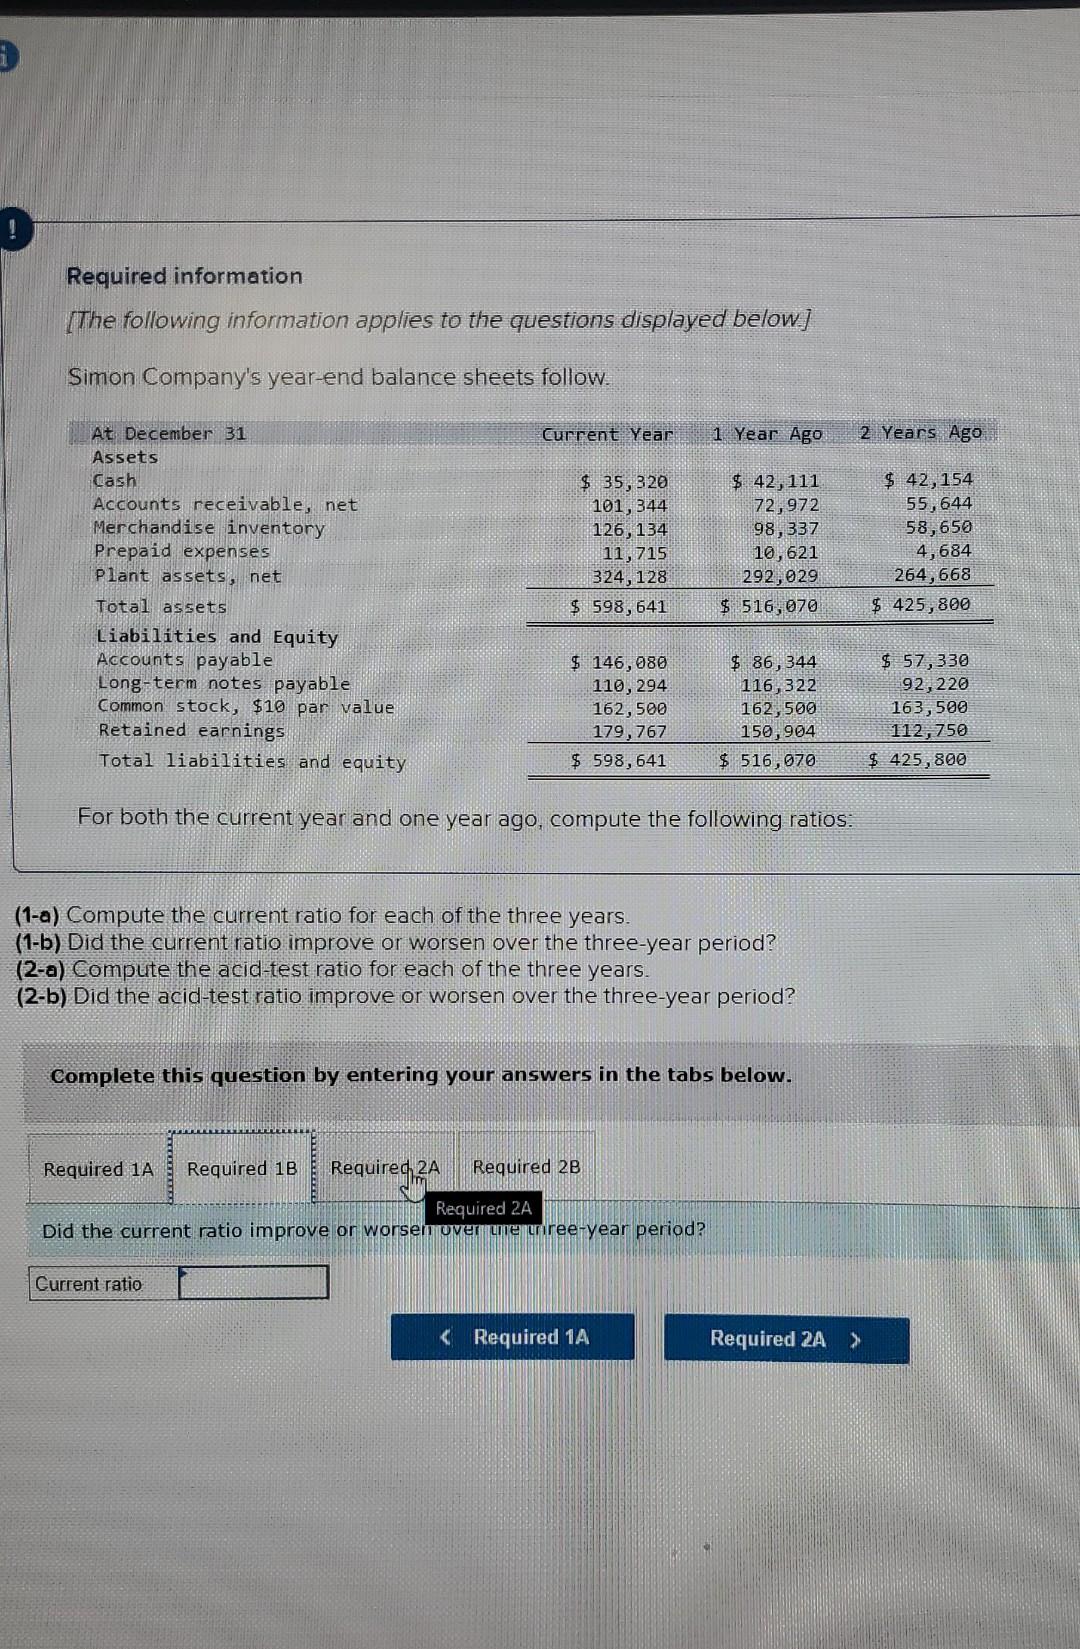
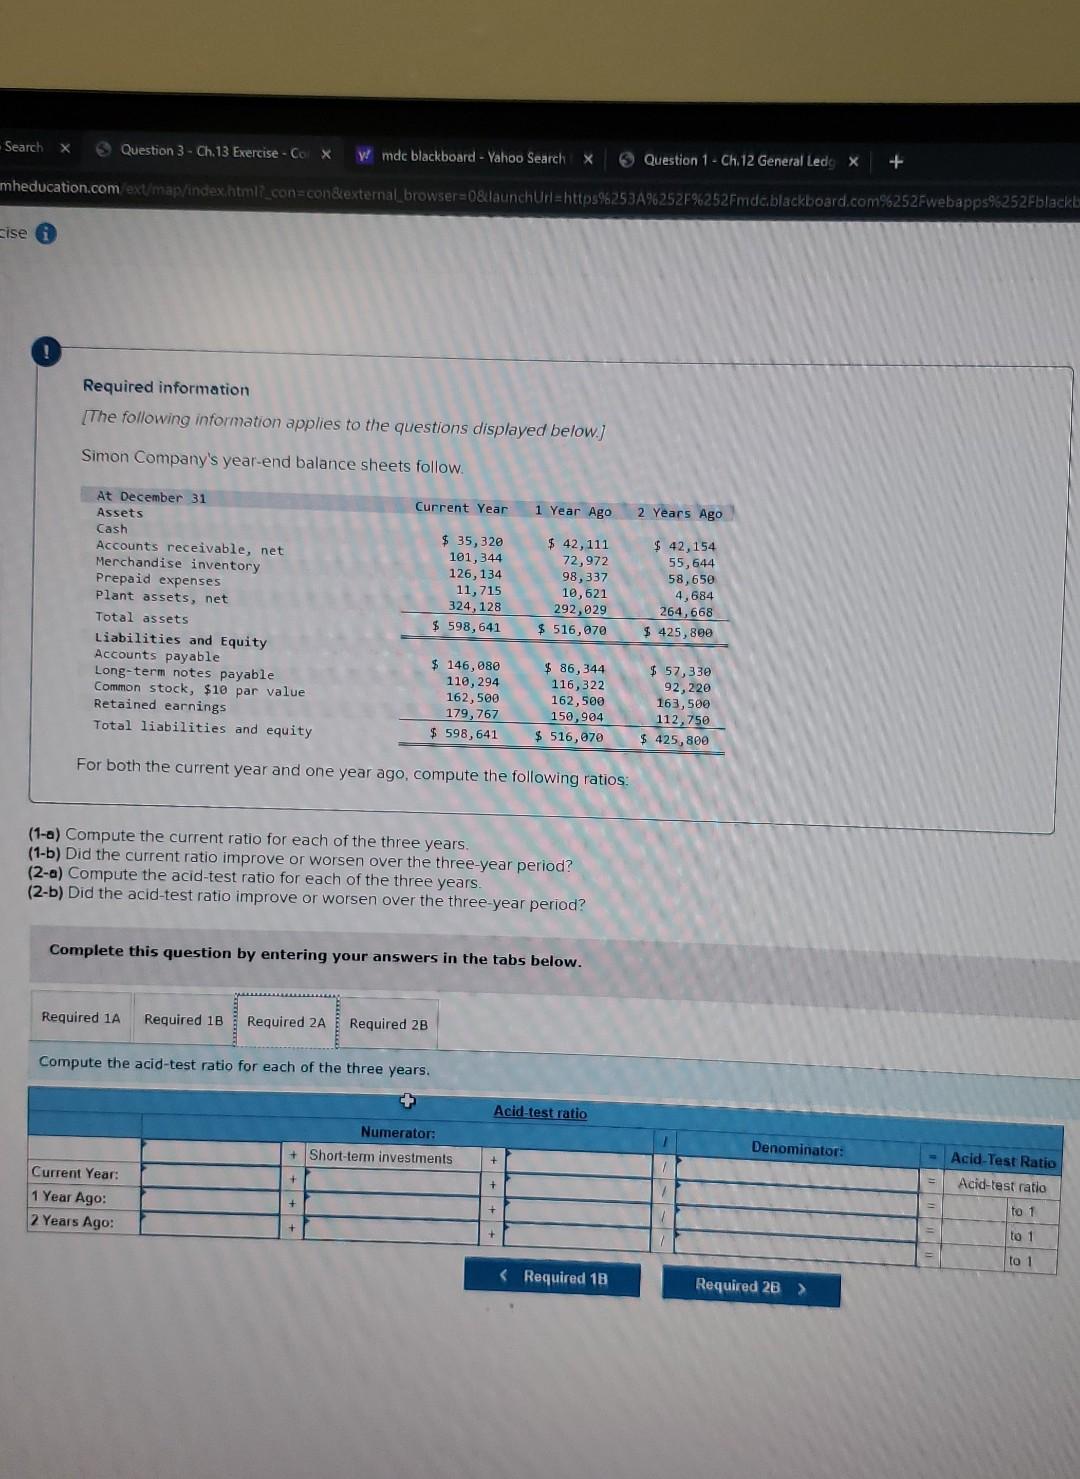
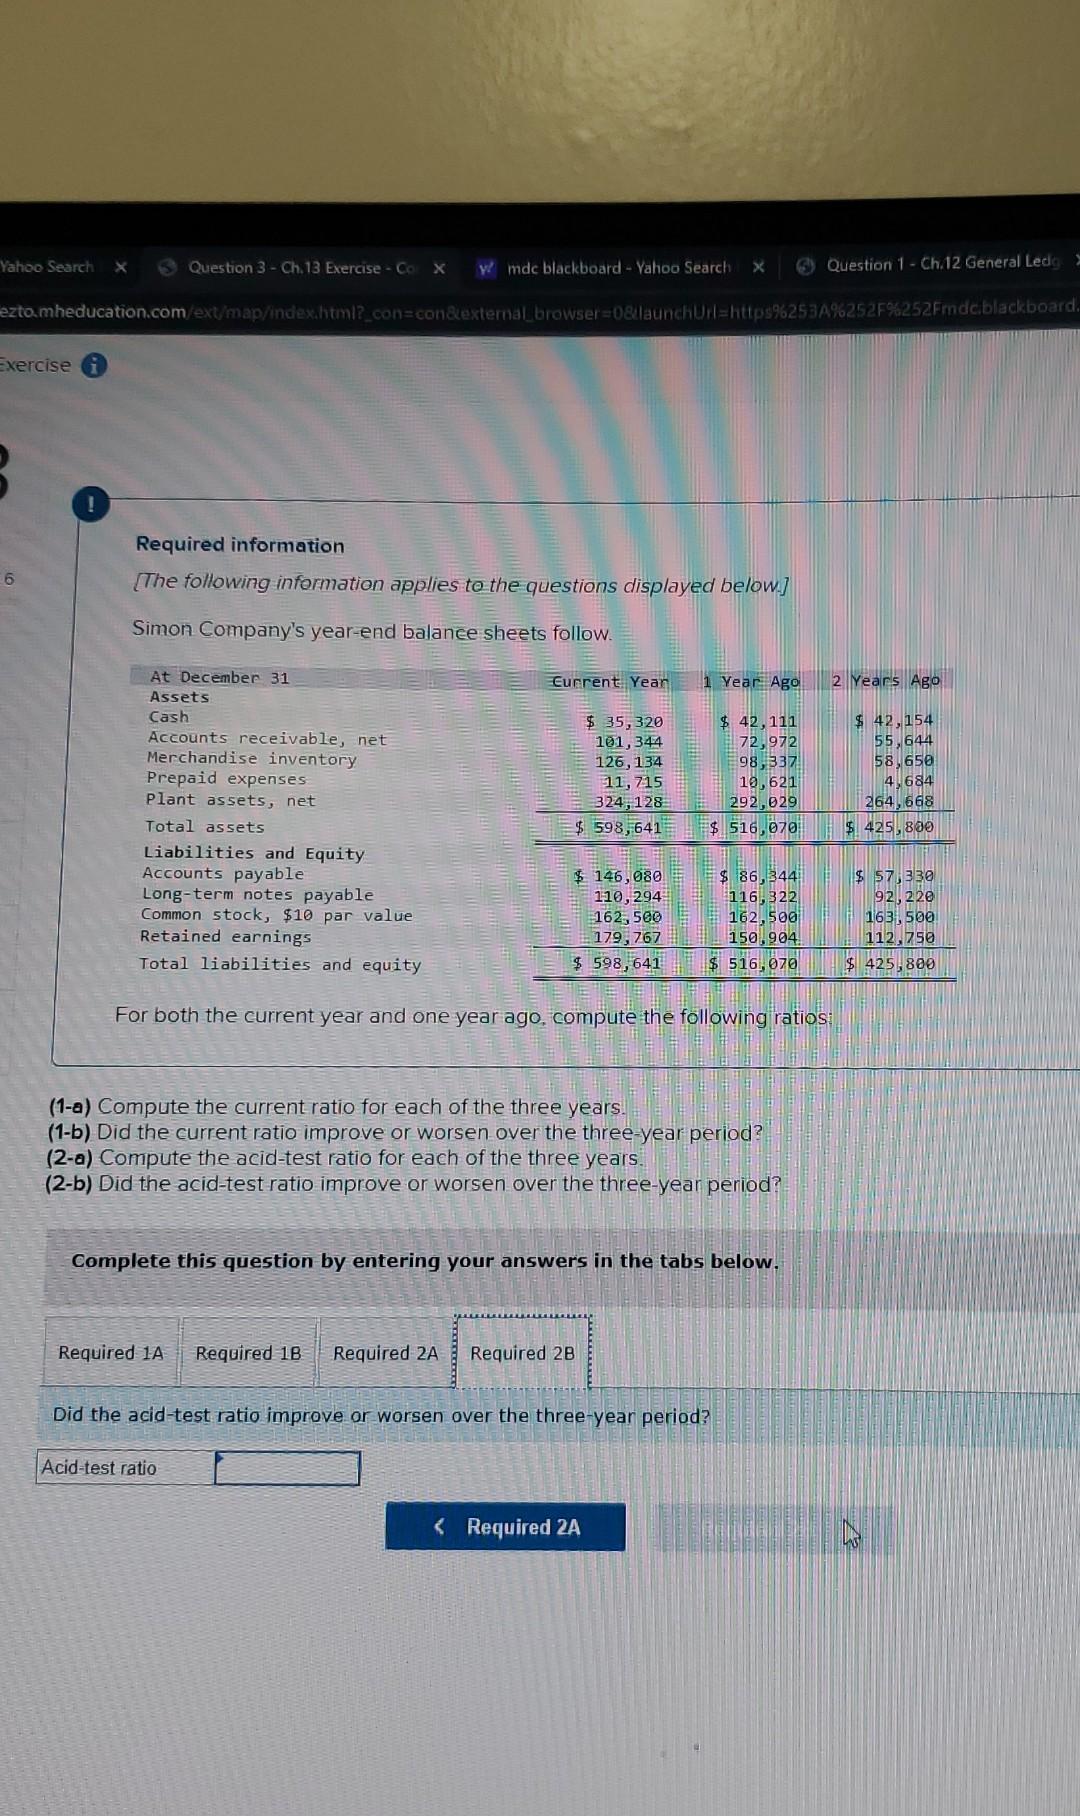
6 es Required information [The following information applies to the questions displayed below] Simon Company's year-end balance sheets follow. At December 31 Assets Cash Accounts receivable, net Merchandise inventory Prepaid expenses Plant assets, net Total assets Current Year $ 35,320 101,344 126, 134 11,715 324, 128 $598,641 Liabilities and Equity Accounts payable Long-term notes payable Common stock, $10 par value Retained earnings Total liabilities and equity For both the current year and one year ago, compute the following ratios: Compute the current ratio for each of the three years. Current Year: 1 Year Ago: 2 Years Ago: Required 1A Required 1B Required 2A Required 2B Numerator: $ 146,080 110,294 162,500 179,767 $ 598,641 (1-a) Compute the current ratio for each of the three years. (1-b) Did the current ratio improve or worsen over the three-year period? (2-a) Compute the acid-test ratio for each of the three years. (2-b) Did the acid-test ratio improve or worsen over the three-year period? Current Ratio Complete this question by entering your answers in the tabs below. 1 Year Ago $ 42,111 72,972 98,337 10,621 292,029 $ 516,070 Denominator: Required 1A $ 86,344 116,322 162,500 150,904 $ 516,070 2 Years Ago $ 42,154 55,644 58,650 4,684 264,668 $425,800 $ 57,330 92,220 163,500 112.750 $425,800 Current Ratio Current ratio to 1 to 1 to 1 Required 1B > Required information [The following information applies to the questions displayed below] Simon Company's year-end balance sheets follow. At December 31 Assets Cash Accounts receivable, net Merchandise inventory Prepaid expenses Plant assets, net Total assets Liabilities and Equity Accounts payable Long-term notes payable Common stock, $10 par value Retained earnings Total liabilities and equity Current Year $ 35,320 101, 344 126, 134 11,715 324, 128 $ 598, 641 Required 1A $ 146,080 110, 294 162,500 179,767 $598,641 For both the current year and one year ago, compute the following ratios: Current ratio (1-a) Compute the current ratio for each of the three years. (1-b) Did the current ratio improve or worsen over the three-year period? (2-a) Compute the acid-test ratio for each of the three years. (2-b) Did the acid-test ratio improve or worsen over the three-year period? Required 1B Required 2A Required 2B Required 2A Did the current ratio improve or worsen over the three-year period? Complete this question by entering your answers in the tabs below. 1 Year Ago 2 Years Ago $ 42,111 72,972 98,337 10, 621 292,029 $ 516,070 $ 86,344 116,322 162,500 150,904 $ 516,070 $ 42,154 55,644 58,650 4,684 264,668 $ 425,800 $57,330 92,220 163,500 112,750 $ 425,800 Question 3- Ch.13 Exercise - Co X y mdc blackboard - Yahoo Search X mheducation.com/ext/map/index.html?_con=con&external_browser=0&launch Search X cise Required information [The following information applies to the questions displayed below.] Simon Company's year-end balance sheets follow. At December 31 Assets Cash Accounts receivable, net Merchandise inventory Prepaid expenses Plant assets, net Total assets Required 1A Required 1B Liabilities and Equity Accounts payable Long-term notes payable Common stock, $10 par value Retained earnings Total liabilities and equity For both the current year and one year ago, compute the following ratios: Current Year $ 35, 320 101,344 126, 134 11,715 324, 128 $598,641 Current Year: 1 Year Ago: 2 Years Ago: Required 2A Required 2B Compute the acid-test ratio for each of the three years. (1-a) Compute the current ratio for each of the three years. (1-b) Did the current ratio improve or worsen over the three-year period? (2-a) Compute the acid-test ratio for each of the three years. (2-b) Did the acid-test ratio improve or worsen over the three-year period? Complete this question by entering your answers in the tabs below. + $ 146,080 110, 294 162,500 179,767 $ 598,641 Numerator: + Short-term investments + + Question 1- Ch.12 General Ledg X Url=https%253A%252F%252Fmdc.blackboard.com%252Fwebapps%252Fblackb 1 Year Ago + $ 42,111 72,972 98,337 10,621 292,029 $ 516,070 + + $ 86,344 116,322 162,500 150,904 $ 516,070 Acid-test ratio + -Acid-Test Ratio Acid-test ratio to 1 to 1 to 1 Yahoo Search Question 3 - Ch.13 Exercise - Co X y mdc blackboard - Yahoo Search X ezto.mheducation.com/ext/map/index.html?_con=con&external_browser=0&launchUrl=https%253A%252F%252Fmdc.blackboard. Exercise 6 Required information [The following information applies to the questions displayed below.] Simon Company's year-end balance sheets follow. At December 31 Assets Cash Accounts receivable, net Merchandise inventory Prepaid expenses Plant assets, net Total assets Liabilities and Equity Accounts payable Long-term notes payable Common stock, $10 par value Retained earnings Total liabilities and equity Current Year Required 1A Required 18 Required 2A $ 35,320 101,344 126, 134 11,715 324, 128 $598,641 $146,080 110,294 162,500 179,767 $ 598,641 Acid-test ratio 1 Year Ago (1-a) Compute the current ratio for each of the three years. (1-b) Did the current ratio improve or worsen over the three-year period? (2-a) Compute the acid-test ratio for each of the three years. (2-b) Did the acid-test ratio improve or worsen over the three-year period? Required 2B $ 42,111 72,972 98,337 10,621 292,029 $ 516,070 For both the current year and one year ago, compute the following ratios: Complete this question by entering your answers in the tabs below. $ 86,344 116,322 162,500 150,904 $ 516,070
Step by Step Solution
There are 3 Steps involved in it
Step: 1

Get Instant Access to Expert-Tailored Solutions
See step-by-step solutions with expert insights and AI powered tools for academic success
Step: 2

Step: 3

Ace Your Homework with AI
Get the answers you need in no time with our AI-driven, step-by-step assistance
Get Started


