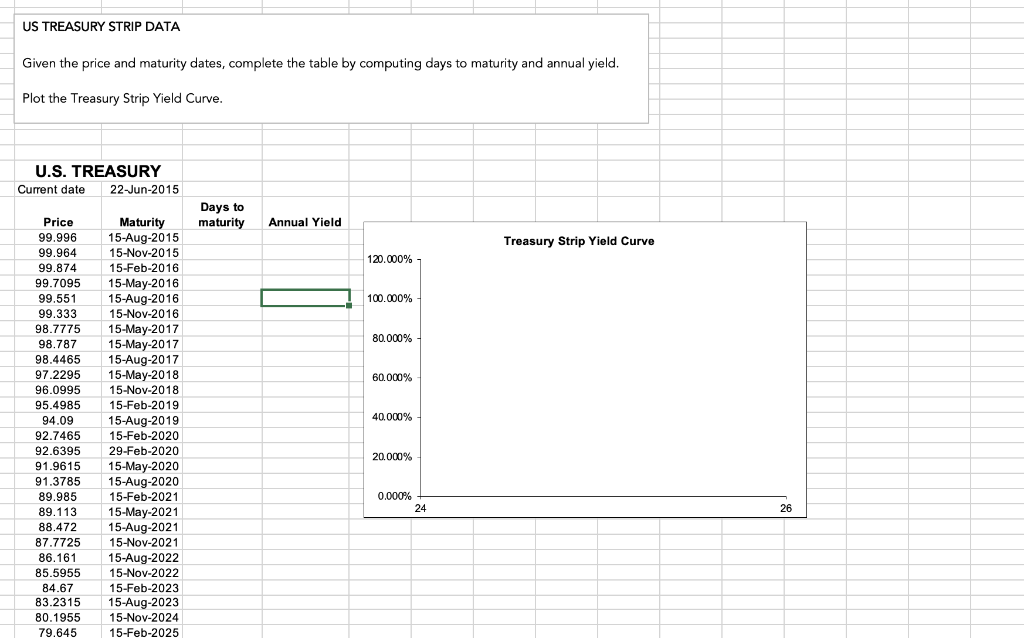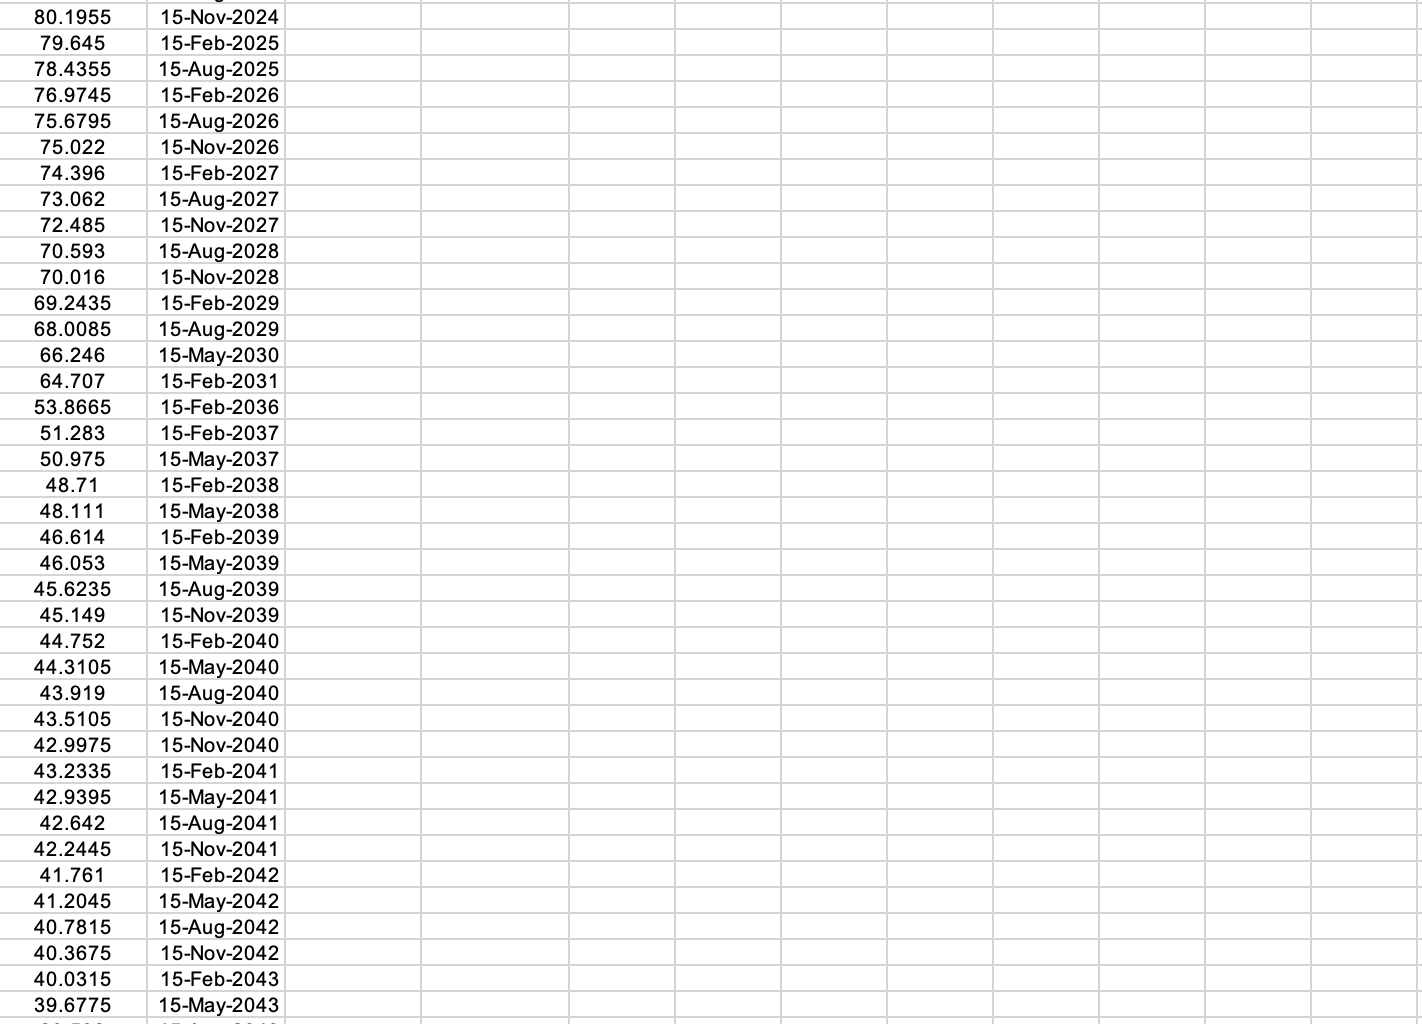


US TREASURY STRIP DATA Given the price and maturity dates, complete the table by computing days to maturity and annual yield. Plot the Treasury Strip Yield Curve. U.S. TREASURY Current date 22-Jun-2015 Days to maturity Annual Yield Treasury Strip Yield Curve 120.000% 100.000% 80.000% 60.000% 40.000% Price 99.996 99.964 99.874 99.7095 99.551 99.333 98.7775 98.787 98.4465 97.2295 96.0995 95.4985 94.09 92.7465 92.6395 91.9615 91.3785 89.985 89.113 88.472 87.7725 86.161 85.5955 84.67 83.2315 80.1955 79.645 Maturity 15-Aug-2015 15-Nov-2015 15-Feb-2016 15-May-2016 15-Aug-2016 15-Nov-2016 15-May-2017 15-May-2017 15-Aug-2017 15-May-2018 15-Nov-2018 15-Feb-2019 15-Aug-2019 15-Feb-2020 29-Feb-2020 15-May-2020 15-Aug-2020 15-Feb-2021 15-May-2021 15-Aug-2021 15-Nov-2021 15-Aug-2022 15-Nov-2022 15-Feb-2023 15-Aug-2023 15-Nov-2024 15-Feb-2025 20.000% 0.000% 24 26 80.1955 79.645 78.4355 76.9745 75.6795 75.022 74.396 73.062 72.485 70.593 70.016 69.2435 68.0085 66.246 64.707 53.8665 51.283 50.975 48.71 48.111 46.614 46.053 45.6235 45.149 44.752 44.3105 43.919 43.5105 42.9975 43.2335 42.9395 42.642 42.2445 41.761 41.2045 40.7815 40.3675 40.0315 39.6775 15-Nov-2024 15-Feb-2025 15-Aug-2025 15-Feb-2026 15-Aug-2026 15-Nov-2026 15-Feb-2027 15-Aug-2027 15-Nov-2027 15-Aug-2028 15-Nov-2028 15-Feb-2029 15-Aug-2029 15-May-2030 15-Feb-2031 15-Feb-2036 15-Feb-2037 15-May-2037 15-Feb-2038 15-May-2038 15-Feb-2039 15-May-2039 15-Aug-2039 15-Nov-2039 15-Feb-2040 15-May-2040 15-Aug-2040 15-Nov-2040 15-Nov-2040 15-Feb-2041 15-May-2041 15-Aug-2041 15-Nov-2041 15-Feb-2042 15-May-2042 15-Aug-2042 15-Nov-2042 15-Feb-2043 15-May-2043 40.0315 39.6775 39.593 39.299 38.8095 38.4935 38.256 38.055 37.906 15-Feb-2043 15-May-2043 15-Aug-2043 15-Nov-2043 15-Feb-2044 15-May-2044 15-Aug-2044 15-Nov-2044 15-Feb-2045 US TREASURY STRIP DATA Given the price and maturity dates, complete the table by computing days to maturity and annual yield. Plot the Treasury Strip Yield Curve. U.S. TREASURY Current date 22-Jun-2015 Days to maturity Annual Yield Treasury Strip Yield Curve 120.000% 100.000% 80.000% 60.000% 40.000% Price 99.996 99.964 99.874 99.7095 99.551 99.333 98.7775 98.787 98.4465 97.2295 96.0995 95.4985 94.09 92.7465 92.6395 91.9615 91.3785 89.985 89.113 88.472 87.7725 86.161 85.5955 84.67 83.2315 80.1955 79.645 Maturity 15-Aug-2015 15-Nov-2015 15-Feb-2016 15-May-2016 15-Aug-2016 15-Nov-2016 15-May-2017 15-May-2017 15-Aug-2017 15-May-2018 15-Nov-2018 15-Feb-2019 15-Aug-2019 15-Feb-2020 29-Feb-2020 15-May-2020 15-Aug-2020 15-Feb-2021 15-May-2021 15-Aug-2021 15-Nov-2021 15-Aug-2022 15-Nov-2022 15-Feb-2023 15-Aug-2023 15-Nov-2024 15-Feb-2025 20.000% 0.000% 24 26 80.1955 79.645 78.4355 76.9745 75.6795 75.022 74.396 73.062 72.485 70.593 70.016 69.2435 68.0085 66.246 64.707 53.8665 51.283 50.975 48.71 48.111 46.614 46.053 45.6235 45.149 44.752 44.3105 43.919 43.5105 42.9975 43.2335 42.9395 42.642 42.2445 41.761 41.2045 40.7815 40.3675 40.0315 39.6775 15-Nov-2024 15-Feb-2025 15-Aug-2025 15-Feb-2026 15-Aug-2026 15-Nov-2026 15-Feb-2027 15-Aug-2027 15-Nov-2027 15-Aug-2028 15-Nov-2028 15-Feb-2029 15-Aug-2029 15-May-2030 15-Feb-2031 15-Feb-2036 15-Feb-2037 15-May-2037 15-Feb-2038 15-May-2038 15-Feb-2039 15-May-2039 15-Aug-2039 15-Nov-2039 15-Feb-2040 15-May-2040 15-Aug-2040 15-Nov-2040 15-Nov-2040 15-Feb-2041 15-May-2041 15-Aug-2041 15-Nov-2041 15-Feb-2042 15-May-2042 15-Aug-2042 15-Nov-2042 15-Feb-2043 15-May-2043 40.0315 39.6775 39.593 39.299 38.8095 38.4935 38.256 38.055 37.906 15-Feb-2043 15-May-2043 15-Aug-2043 15-Nov-2043 15-Feb-2044 15-May-2044 15-Aug-2044 15-Nov-2044 15-Feb-2045


