6 Exercise 8-27 (Algo) (LO8-3) correct): 83, 76, 82, 84, 89, and 73. The instructor decided to randomly select two exam scores, compute their mean,
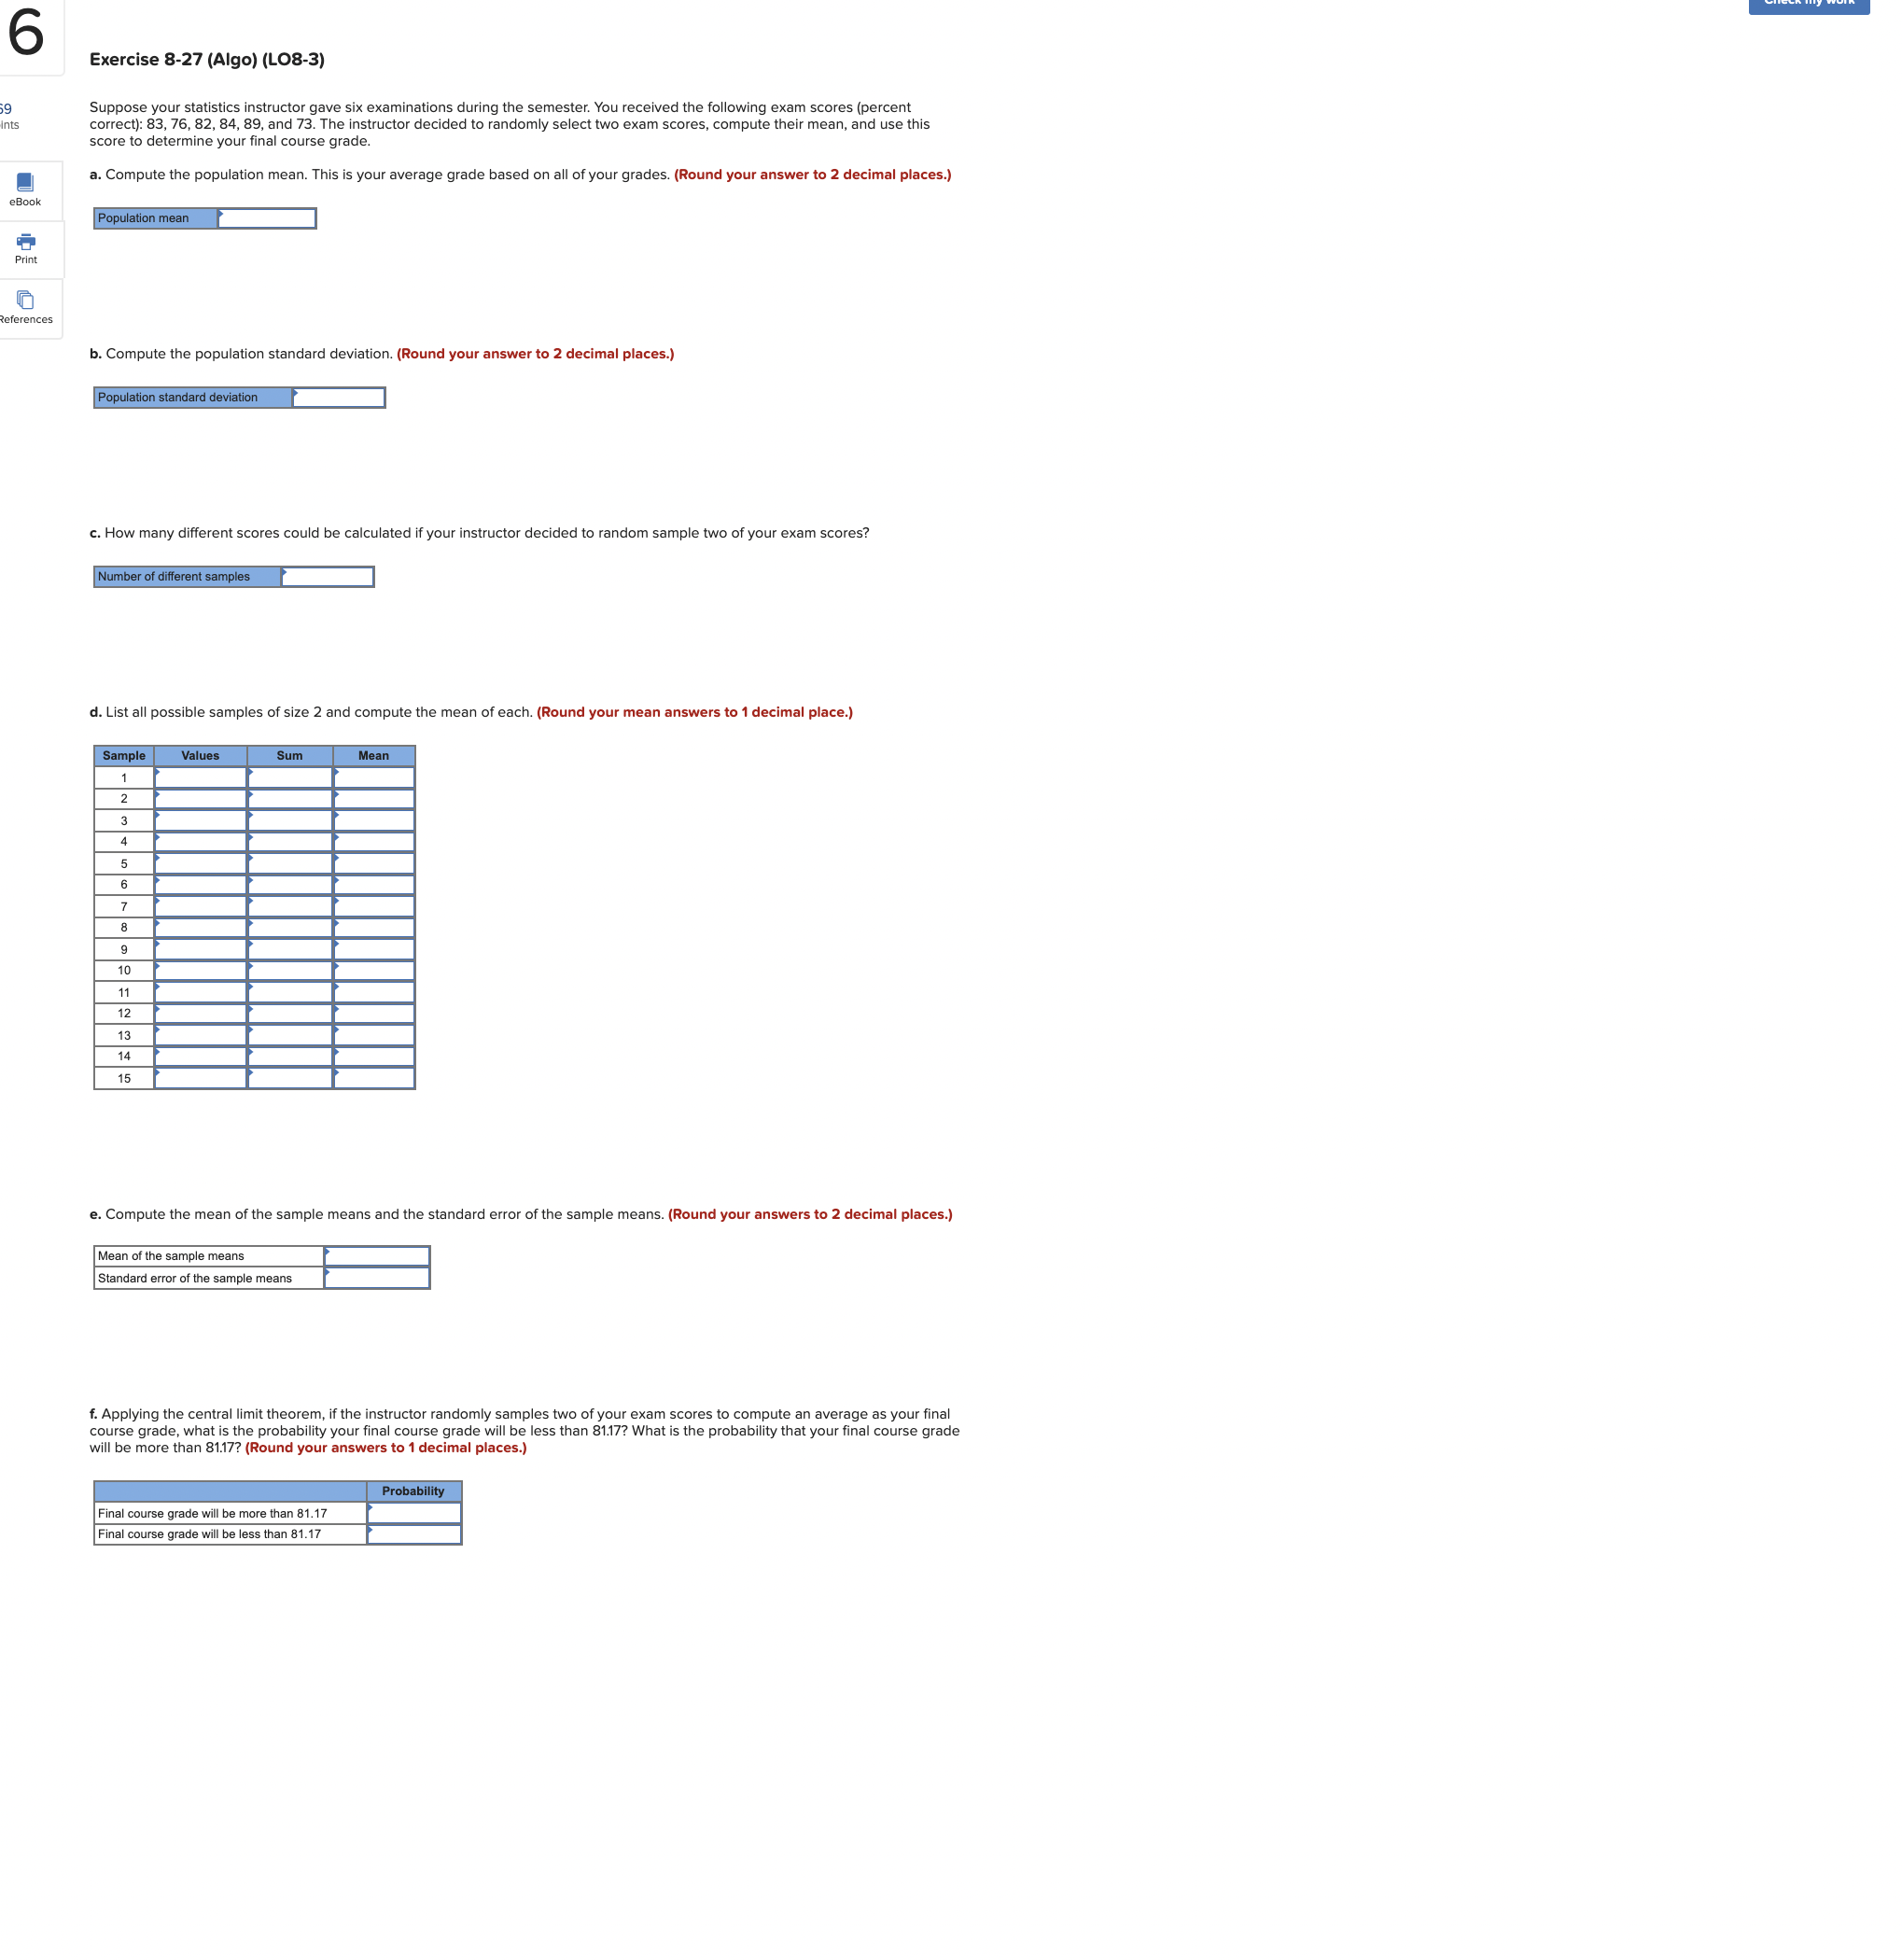
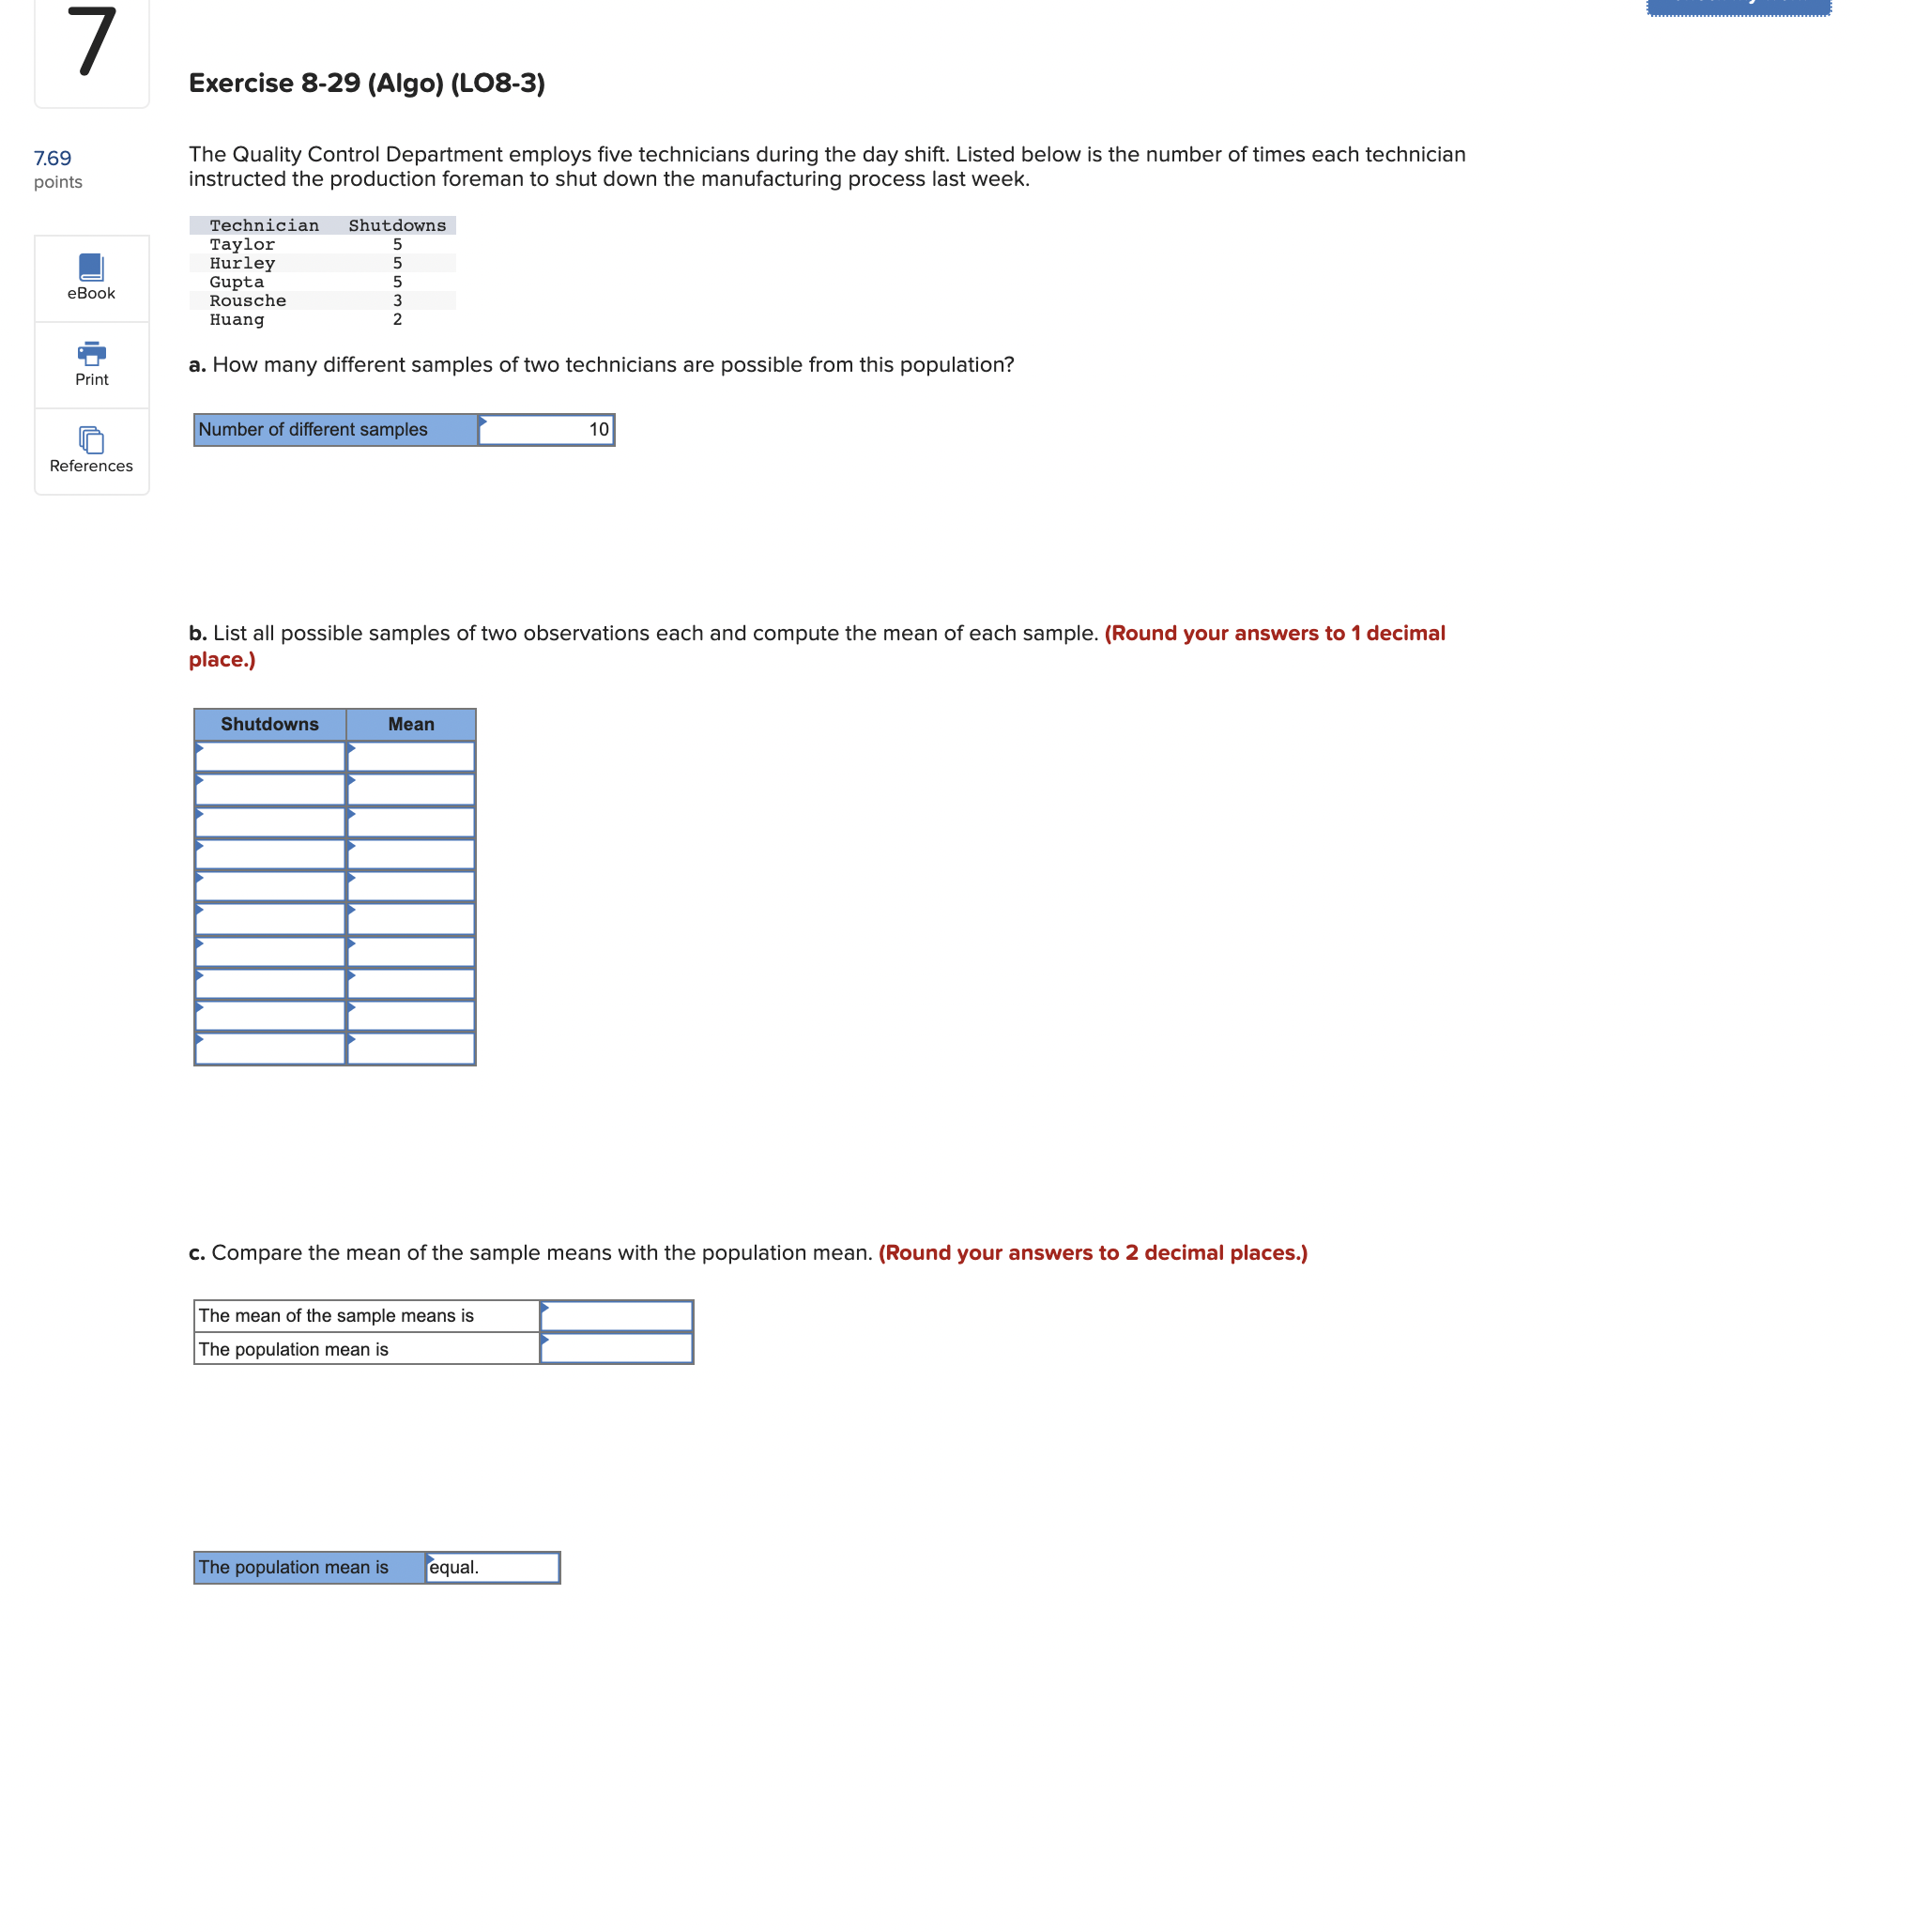
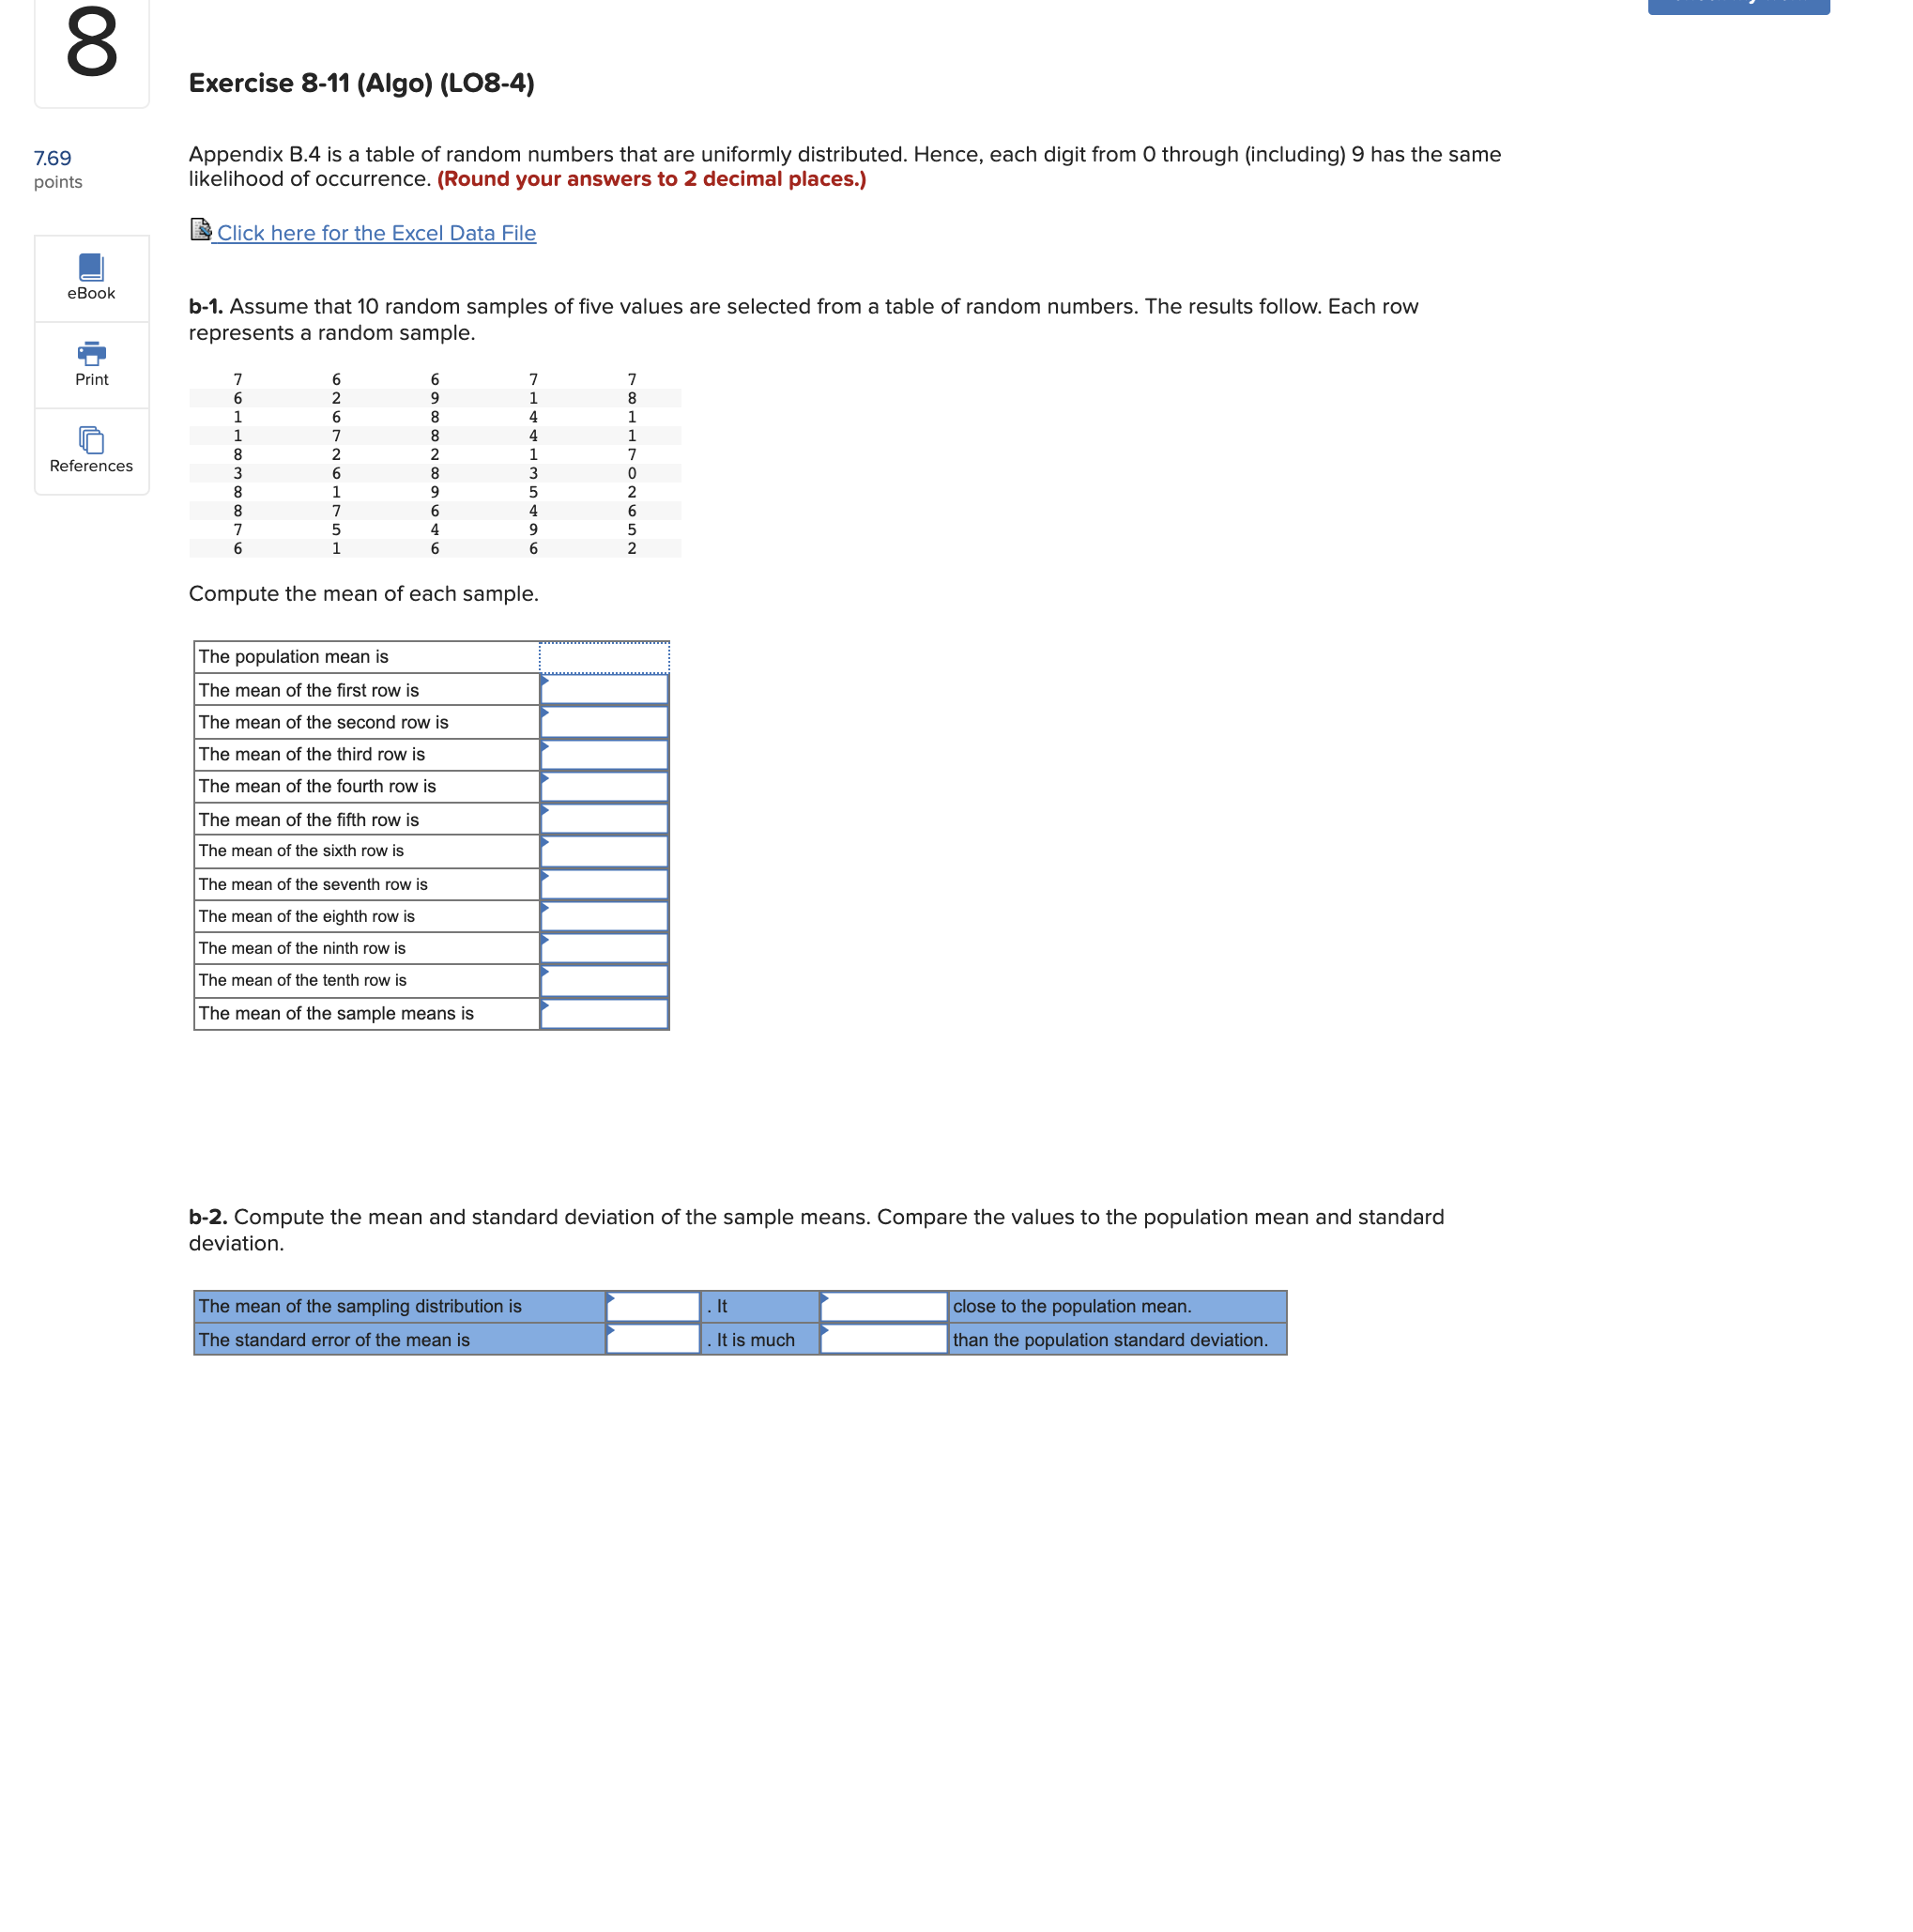
6 Exercise 8-27 (Algo) (LO8-3) correct): 83, 76, 82, 84, 89, and 73. The instructor decided to randomly select two exam scores, compute their mean, and use this score to determine your final course grade. . Compute the population mean. This is your average grade based on all of your grades. (Round your answer to 2 decimal places.) BOOK Population mean Print aferences b. Compute the population standard deviation. (Round your answer to 2 decimal places.) Population standard deviation C. How many different scores could be calculated if your instructor decided to random sample two of your exam scores? Number of different samples d. List all possible samples of size 2 and compute the mean of each. (Round your mean answers to 1 decimal place.) Sample e. Compute the mean of the sample means and the standard error of the sample means. (Round your answers to 2 decimal places.) Mean of the sample means Standard error of the sample means course grade. what is the probability you probability your final course grade wai bel indomly samples two of your exam scores to compute an average as your final will be more than 81.17? (Round your answers to 1 decimal places.) Probability Final course grade will be more than 81.17 Final course grade will be less than 81.177 Exercise 8-29 (Algo) (LO8-3) 7.69 The Quality Control Department employs five technicians during the day shift. Listed below is the number of times each technician points instructed the production foreman to shut down the manufacturing process last week. Technician Shutdowns Taylor Hurley Book Gupta Rousche Huang Print a. How many different samples of two technicians are possible from this population? Number of different samples 10 References b. List all possible samples of two observations each and compute the mean of each sample. (Round your answers to 1 decimal place.) Shutdowns Mean c. Compare the mean of the sample means with the population mean. (Round your answers to 2 decimal places.) The mean of the sample means is The population mean is The population mean is equal.8 Exercise 8-11 (Algo) (LO8-4) 7.69 Appendix B.4 is a table of random numbers that are uniformly distributed. Hence, each digit from 0 through (including) 9 has the same points likelihood of occurrence. (Round your answers to 2 decimal places.) Click here for the Excel Data File Book b-1. Assume that 10 random samples of five values are selected from a table of random numbers. The results follow. Each row represents a random sample Print References NUGNONTHOON Compute the mean of each sample. The population mean is The mean of the first row is The mean of the second row is The mean of the third row is The mean of the fourth row is The mean of the fifth row is The mean of the sixth row is The mean of the seventh row is The mean of the eighth row is The mean of the ninth row is The mean of the tenth row is The mean of the sample means is b-2. Compute the mean and standard deviation of the sample means. Compare the values to the population mean and standard deviation. The mean of the sampling distribution is . It close to the population mean. The standard error of the mean is . It is much than the population standard deviation
Step by Step Solution
There are 3 Steps involved in it
Step: 1
Get Instant Access to Expert-Tailored Solutions
See step-by-step solutions with expert insights and AI powered tools for academic success
Step: 2
Step: 3
Ace Your Homework with AI
Get the answers you need in no time with our AI-driven, step-by-step assistance