6) Exhibit B has the Balance Sheet and Income Statement projections for a specific company. The company is evaluating if it is worth it to have the capital investment as show in the Capital Investment Sheet. The EBITDA multiplier of similar companies is 9. The debt used has a coupon of 6.8%. Answer these questions: a. What is the continuation value of the firm? b. What is the present value of the interest tax shield? c. What is the value of the firm if the WACC is 10% and should they take the project?
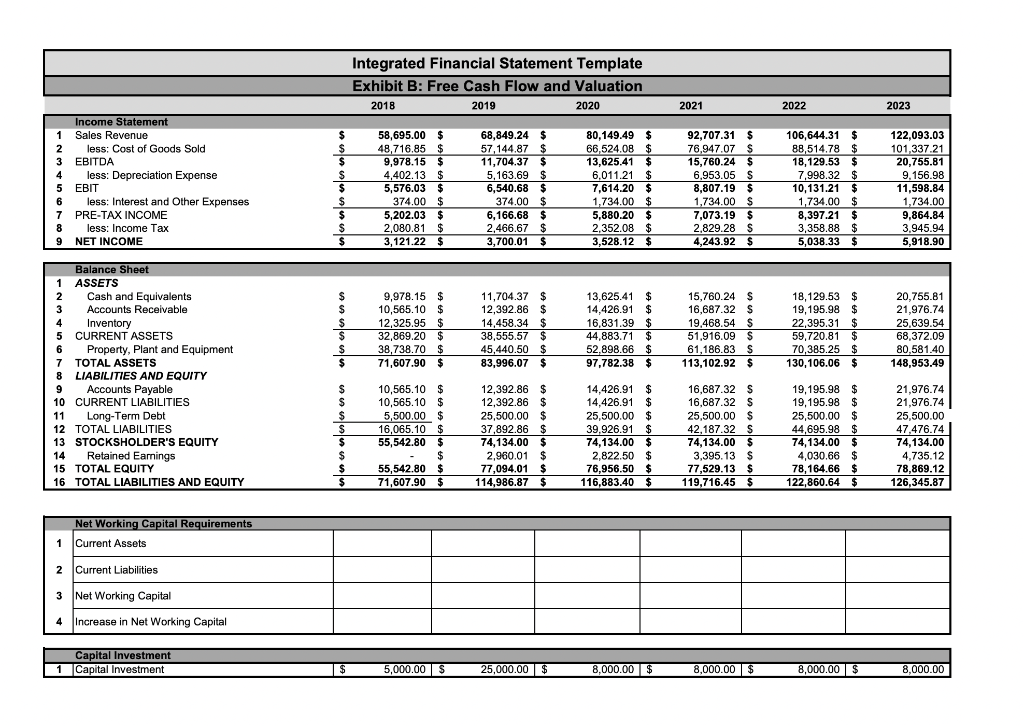
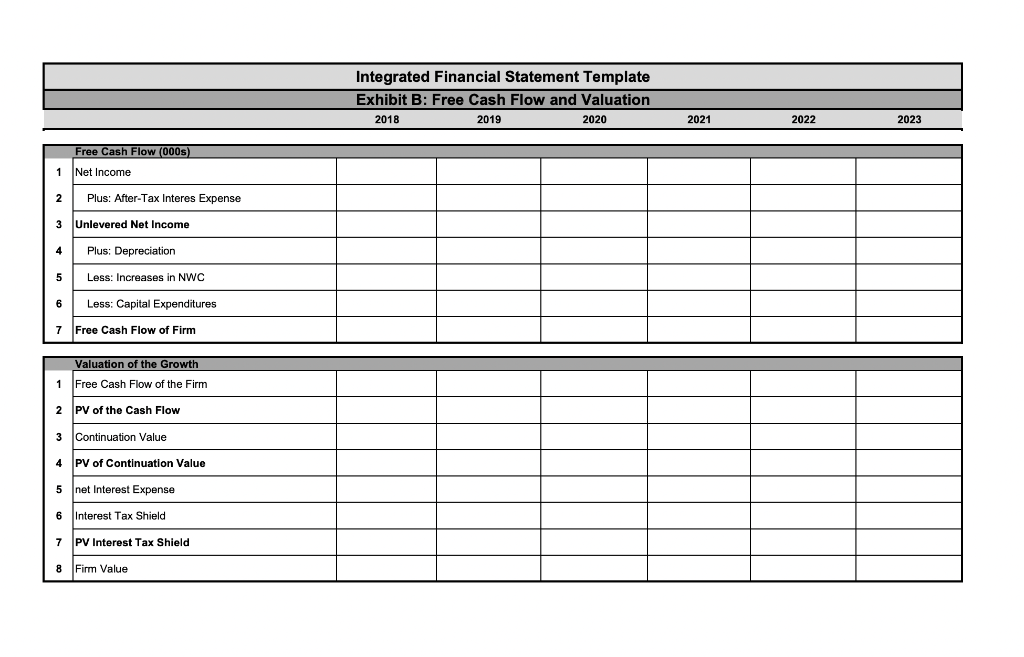
Integrated Financial Statement Template Exhibit B: Free Cash Flow and Valuation 2018 2019 2020 2021 2022 2023 Income Statement 1 Sales Revenue 2 less: Cost of Goods Sold 3 EBITDA 4 less: Depreciation Expense 5 EBIT 6 less: Interest and Other Expenses 7 PRE-TAX INCOME 8 less: Income Tax : 9 9 NET INCOME $ $ $ $ $ $ $ $ $ $ 58,695.00 $ 48,716.85 $ 9,978.15 $ 4,402.13 $ 5,576.03 $ 374.00 $ 5,202.03 $ 2,080.81 $ 3,121.22 $ 68,849.24 $ 57,144.87 $ 11,704.37 $ 5,163.69 $ 6,540.68 $ 374.00 $ 6,166.68 $ 2,466.67 $ 3,700.01 $ 80,149.49 $ 66,524.08 $ 13,625.41 $ 6,011.21 $ 7,614.20 $ 1,734.00 $ 5,880.20 $ 2,352.08 $ 3,528.12 $ 92,707.31 $ 76,947.07 $ 15,760.24 $ 6,953.05 $ 8,807.19 $ 1,734.00 S 7,073.19 $ 2.829.28 S 4,243.92 $ 106,644.31 $ 88,514.78 $ 18,129.53 $ 7,998.32 $ 10,131.21 $ 1,734.00 $ 8,397.21 $ 3,358.88 $ 5,038.33 $ 122,093.03 101,337.21 20,755.81 9,156.98 11,598.84 1,734.00 9,864.84 3.945.94 5,918.90 $ $ $ $ $ $ 9,978.15 $ 10,565.10 $ 12,325.95 $ 32,869.20 $ 38,738.70 $ 71,607.90 $ 11,704.37 $ 12,392.86 $ 14,458.34 $ 38,555.57 $ 45,440.50 $ 83,996.07 $ 13,625.41 $ 14,426.91 $ 16,831.39 $ 44,883.71 $ 52,898.66 $ 97,782.38 $ 15,760.24 S 16,687.32 $ 19,468.54 $ 51.916.09 $ 61,186.83 S 113,102.92 $ 18,129.53 $ 19,195.98 $ 22,395.31 $ 59,720.81 $ 70,385.25 $ 130,106.06 $ 20,755.81 21,976.74 25,639.54 68,372.09 80,581.40 148,953.49 Balance Sheet 1 ASSETS 2 Cash and Equivalents 3 Accounts Receivable 4 Inventory 5 CURRENT ASSETS 6 Property, Plant and Equipment 7 TOTAL ASSETS 8 LIABILITIES AND EQUITY 9 9 Accounts Payable 10 CURRENT LIABILITIES 11 Long-Term Debt 12 TOTAL LIABILITIES 13 STOCKSHOLDER'S EQUITY 14 Retained Earnings 15 TOTAL EQUITY 16 TOTAL LIABILITIES AND EQUITY $ $ $ $ $ $ $ $ $ 10,565.10 $ 10,565.10 $ 5,500.00 $ 16,065.10 $ 55,542.80 $ $ 55,542.80 $ 71,607.90 $ 12,392.86 $ 12,392.86 $ 25,500.00 $ 37,892.86 $ 74,134.00 $ 2.960.01 $ 77,094.01 $ 114,986.87 $ 14,426.91 $ 14,426.91 $ 25,500.00 $ 39.926.91 $ 74,134.00 $ 2,822.50 $ 76,956.50 $ 116,883.40 $ 16,687.32 S 16,687.32 S 25,500.00 $ 42,187.32 S 74,134.00 $ 3,395.13 S 77,529.13 $ 119,716.45 $ 19,195.98 $ 19,195.98 $ 25,500.00 $ 44,695.98 $ 74, 134.00 $ 4,030.66 $ 78,164.66 $ 122,860.64 $ 21,976.74 21,976.74 25,500.00 47,476.74 74,134.00 4,735.12 78,869.12 126,345.87 Net Working Capital Requirements 1 Current Assets 2 Current Liabilities 3 Net Working Capital 4 Increase in Net Working Capital Capital Investment 1 Capital Investment $ 5,000.00 $ 25,000.00 $ 8,000.00 $ 8,000.00 $ 8,000.00 $ 8,000.00 Integrated Financial Statement Template Exhibit B: Free Cash Flow and Valuation 2018 2019 2020 2021 2022 2023 Free Cash Flow (000s) 1 Net Income 2 Plus: After-Tax Interes Expense 3 Unlevered Net Income 4 Plus: Depreciation 5 Less: Increases in NWC 6 Less: Capital Expenditures 7 Free Cash Flow of Firm Valuation of the Growth 1 Free Cash Flow of the Firm 2 PV of the Cash Flow 3 Continuation Value PV Continuation Value 5 net Interest Expense 6 Interest Tax Shield 7 PV Interest Tax Shield 8 Firm Value Integrated Financial Statement Template Exhibit B: Free Cash Flow and Valuation 2018 2019 2020 2021 2022 2023 Income Statement 1 Sales Revenue 2 less: Cost of Goods Sold 3 EBITDA 4 less: Depreciation Expense 5 EBIT 6 less: Interest and Other Expenses 7 PRE-TAX INCOME 8 less: Income Tax : 9 9 NET INCOME $ $ $ $ $ $ $ $ $ $ 58,695.00 $ 48,716.85 $ 9,978.15 $ 4,402.13 $ 5,576.03 $ 374.00 $ 5,202.03 $ 2,080.81 $ 3,121.22 $ 68,849.24 $ 57,144.87 $ 11,704.37 $ 5,163.69 $ 6,540.68 $ 374.00 $ 6,166.68 $ 2,466.67 $ 3,700.01 $ 80,149.49 $ 66,524.08 $ 13,625.41 $ 6,011.21 $ 7,614.20 $ 1,734.00 $ 5,880.20 $ 2,352.08 $ 3,528.12 $ 92,707.31 $ 76,947.07 $ 15,760.24 $ 6,953.05 $ 8,807.19 $ 1,734.00 S 7,073.19 $ 2.829.28 S 4,243.92 $ 106,644.31 $ 88,514.78 $ 18,129.53 $ 7,998.32 $ 10,131.21 $ 1,734.00 $ 8,397.21 $ 3,358.88 $ 5,038.33 $ 122,093.03 101,337.21 20,755.81 9,156.98 11,598.84 1,734.00 9,864.84 3.945.94 5,918.90 $ $ $ $ $ $ 9,978.15 $ 10,565.10 $ 12,325.95 $ 32,869.20 $ 38,738.70 $ 71,607.90 $ 11,704.37 $ 12,392.86 $ 14,458.34 $ 38,555.57 $ 45,440.50 $ 83,996.07 $ 13,625.41 $ 14,426.91 $ 16,831.39 $ 44,883.71 $ 52,898.66 $ 97,782.38 $ 15,760.24 S 16,687.32 $ 19,468.54 $ 51.916.09 $ 61,186.83 S 113,102.92 $ 18,129.53 $ 19,195.98 $ 22,395.31 $ 59,720.81 $ 70,385.25 $ 130,106.06 $ 20,755.81 21,976.74 25,639.54 68,372.09 80,581.40 148,953.49 Balance Sheet 1 ASSETS 2 Cash and Equivalents 3 Accounts Receivable 4 Inventory 5 CURRENT ASSETS 6 Property, Plant and Equipment 7 TOTAL ASSETS 8 LIABILITIES AND EQUITY 9 9 Accounts Payable 10 CURRENT LIABILITIES 11 Long-Term Debt 12 TOTAL LIABILITIES 13 STOCKSHOLDER'S EQUITY 14 Retained Earnings 15 TOTAL EQUITY 16 TOTAL LIABILITIES AND EQUITY $ $ $ $ $ $ $ $ $ 10,565.10 $ 10,565.10 $ 5,500.00 $ 16,065.10 $ 55,542.80 $ $ 55,542.80 $ 71,607.90 $ 12,392.86 $ 12,392.86 $ 25,500.00 $ 37,892.86 $ 74,134.00 $ 2.960.01 $ 77,094.01 $ 114,986.87 $ 14,426.91 $ 14,426.91 $ 25,500.00 $ 39.926.91 $ 74,134.00 $ 2,822.50 $ 76,956.50 $ 116,883.40 $ 16,687.32 S 16,687.32 S 25,500.00 $ 42,187.32 S 74,134.00 $ 3,395.13 S 77,529.13 $ 119,716.45 $ 19,195.98 $ 19,195.98 $ 25,500.00 $ 44,695.98 $ 74, 134.00 $ 4,030.66 $ 78,164.66 $ 122,860.64 $ 21,976.74 21,976.74 25,500.00 47,476.74 74,134.00 4,735.12 78,869.12 126,345.87 Net Working Capital Requirements 1 Current Assets 2 Current Liabilities 3 Net Working Capital 4 Increase in Net Working Capital Capital Investment 1 Capital Investment $ 5,000.00 $ 25,000.00 $ 8,000.00 $ 8,000.00 $ 8,000.00 $ 8,000.00 Integrated Financial Statement Template Exhibit B: Free Cash Flow and Valuation 2018 2019 2020 2021 2022 2023 Free Cash Flow (000s) 1 Net Income 2 Plus: After-Tax Interes Expense 3 Unlevered Net Income 4 Plus: Depreciation 5 Less: Increases in NWC 6 Less: Capital Expenditures 7 Free Cash Flow of Firm Valuation of the Growth 1 Free Cash Flow of the Firm 2 PV of the Cash Flow 3 Continuation Value PV Continuation Value 5 net Interest Expense 6 Interest Tax Shield 7 PV Interest Tax Shield 8 Firm Value