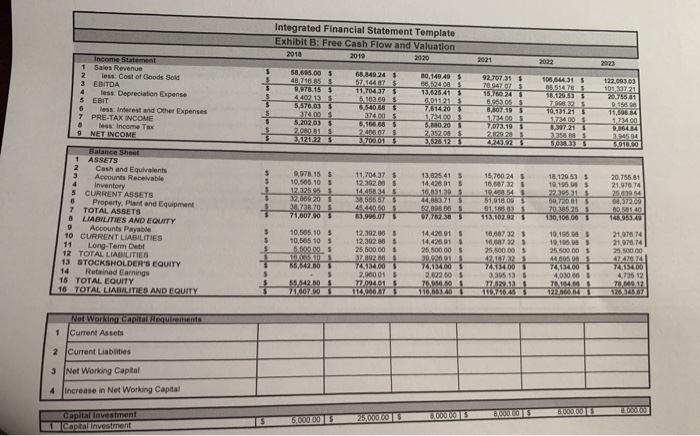
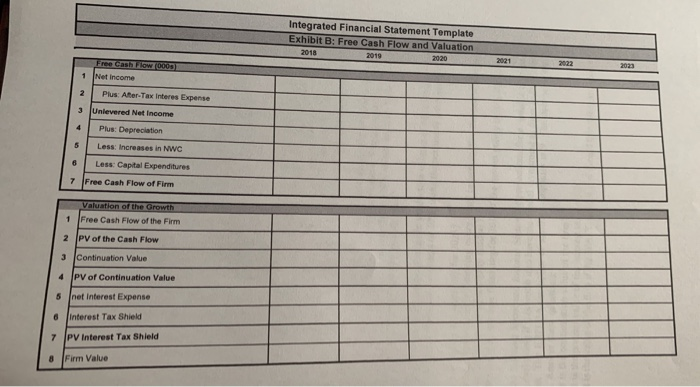
6) Exhibit B has the Balance Sheet and Income Statement projections for a specific company The company is evaluating if it is worth it to have the capital investment as show in the Capital Investment Sheet. The EBITDA multiplier of similar companies is 9. The debt used has a coupon of 6.8%. Answer these questions: a. What is the continuation value of the firm? b. What is the present value of the interest tax shield? c. What is the value of the firm if the WACC is 10% and should they take the project? Integrated Financial Statement Template Exhibit B: Free Cash Flow and Valuation 2018 $ $ 6,840 24 5 80,149.40 58,695.00 48,718 85 978.15 $ 100,844.315 11,704 375 Income Statement 1 Sales Revenue less: Cost of Goods Sold EBITDA 4 less Depreciation Expense 5 EBIT less interest and Other Expenses 7 PRE-TAX INCOME less Income Tax 9 NET INCOME 122.093.03 10133721 2075631 0, 15601 6963053 76140 BM0.20 5.202.035 2080 81 $ 1223 124005 7073195 2.629 285 11,70437 $ 12.302.305 10,605.10 $ 12,325 95$ 13,525.41 $ 14,428.91 $ 15,700 243 16.687325 19,458 54$ 51,016 093 01. 135 T310223 18,120 53 $ 19,1950 $ 22.305 315 39.7215 70,385 255 130510000 20.755 81 21.07874 2539 54 A372769 89.581.40 1749 71,607.90 3 77622385 1 2 Cash and Equivalents Accounts Receivable 4 Inventory 5 CURRENT ASSETS 6 Property, plant and Equipment 7 TOTAL ASSETS 8 LIABILITIES AND EQUITY Accounts Payable 10 CURRENT LIABILITIES 11 Long-Term Debt 12 TOTAL LIABILITIES 13 STOCKSHOLDER'S EQUITY 14 Retained Earnings 16 TOTAL EQUITY 16 TOTAL LIABILITIES AND EQUITY 1239200 14.428015 14 425 915 18.68732 $ 10,565.10 $ 10,585 10 $ 5.600.00 5 TO 10 564280 19,196.885 19,105.08 $ 25 500.00 $ 21.978.74 21 978 74 25,500.00 25.500.00 $ 2,000 01 $ 25,500.00 4241472_1 745134.00 3.305 135 T732135 119 716 455 745154700 40100 7415400 2.22.50 $ 78,05650 $ 116,8740 724315400 4,735.12 55.542.00 7160700 T 12 122.360.645 7257 1 Not Working Capital Requirements Current Assets Current Liabilities Net Working Capital increase in Net Working Capital 3 4 Capital investment 1 capital investment 00002500000 000000000 Integrated Financial Statement Template Exhibit B: Free Cash Flow and Valuation 2018 2019 202 Free Cash Flow 0003) 1 Net Income 2 Plus Ater-Tax Interes Expense 3 Unlevered Net Income 4 Plus: Depreciation Less: Increases in NWC 8 Less: Capital Expenditures 7 Free Cash Flow of Firm Valuation of the Growth 1 Free Cash Flow of the Firm 2 PV of the Cash Flow 3 Continuation Value 4 PV of Continuation Value 6 net interest Expense 6 interest Tax Shield 7 PV interest Tax Shield 8 Firm Value 6) Exhibit B has the Balance Sheet and Income Statement projections for a specific company The company is evaluating if it is worth it to have the capital investment as show in the Capital Investment Sheet. The EBITDA multiplier of similar companies is 9. The debt used has a coupon of 6.8%. Answer these questions: a. What is the continuation value of the firm? b. What is the present value of the interest tax shield? c. What is the value of the firm if the WACC is 10% and should they take the project? Integrated Financial Statement Template Exhibit B: Free Cash Flow and Valuation 2018 $ $ 6,840 24 5 80,149.40 58,695.00 48,718 85 978.15 $ 100,844.315 11,704 375 Income Statement 1 Sales Revenue less: Cost of Goods Sold EBITDA 4 less Depreciation Expense 5 EBIT less interest and Other Expenses 7 PRE-TAX INCOME less Income Tax 9 NET INCOME 122.093.03 10133721 2075631 0, 15601 6963053 76140 BM0.20 5.202.035 2080 81 $ 1223 124005 7073195 2.629 285 11,70437 $ 12.302.305 10,605.10 $ 12,325 95$ 13,525.41 $ 14,428.91 $ 15,700 243 16.687325 19,458 54$ 51,016 093 01. 135 T310223 18,120 53 $ 19,1950 $ 22.305 315 39.7215 70,385 255 130510000 20.755 81 21.07874 2539 54 A372769 89.581.40 1749 71,607.90 3 77622385 1 2 Cash and Equivalents Accounts Receivable 4 Inventory 5 CURRENT ASSETS 6 Property, plant and Equipment 7 TOTAL ASSETS 8 LIABILITIES AND EQUITY Accounts Payable 10 CURRENT LIABILITIES 11 Long-Term Debt 12 TOTAL LIABILITIES 13 STOCKSHOLDER'S EQUITY 14 Retained Earnings 16 TOTAL EQUITY 16 TOTAL LIABILITIES AND EQUITY 1239200 14.428015 14 425 915 18.68732 $ 10,565.10 $ 10,585 10 $ 5.600.00 5 TO 10 564280 19,196.885 19,105.08 $ 25 500.00 $ 21.978.74 21 978 74 25,500.00 25.500.00 $ 2,000 01 $ 25,500.00 4241472_1 745134.00 3.305 135 T732135 119 716 455 745154700 40100 7415400 2.22.50 $ 78,05650 $ 116,8740 724315400 4,735.12 55.542.00 7160700 T 12 122.360.645 7257 1 Not Working Capital Requirements Current Assets Current Liabilities Net Working Capital increase in Net Working Capital 3 4 Capital investment 1 capital investment 00002500000 000000000 Integrated Financial Statement Template Exhibit B: Free Cash Flow and Valuation 2018 2019 202 Free Cash Flow 0003) 1 Net Income 2 Plus Ater-Tax Interes Expense 3 Unlevered Net Income 4 Plus: Depreciation Less: Increases in NWC 8 Less: Capital Expenditures 7 Free Cash Flow of Firm Valuation of the Growth 1 Free Cash Flow of the Firm 2 PV of the Cash Flow 3 Continuation Value 4 PV of Continuation Value 6 net interest Expense 6 interest Tax Shield 7 PV interest Tax Shield 8 Firm Value


