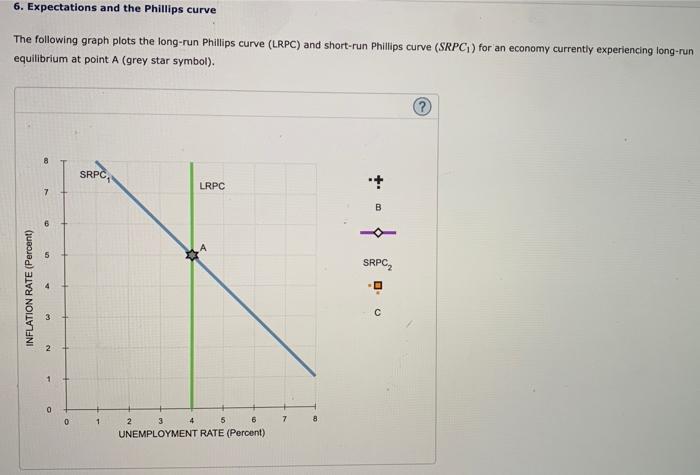
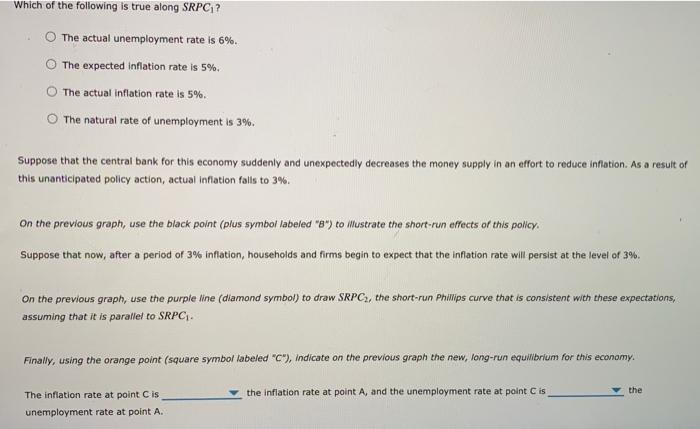
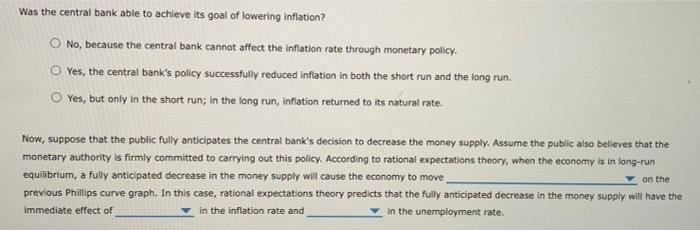
6. Expectations and the Phillips curve The following graph plots the long-run Phillips curve (LRPC) and short-run Phillips curve (SRPC1) for an economy currently experiencing long-run equilibrium at point A (grey star symbol). Which of the following is true along SRPC1 ? The actual unemployment rate is 6%. The expected inflation rate is 5%. The actual inflation rate is 5%. The natural rate of unemployment is 3%. Suppose that the central bank for this economy suddenly and unexpectedly decreases the money supply in an effort to reduce inflation. As a result of this unanticipated policy action, actual inflation falis to 3%. On the previous graph, use the black point (plus symbol labeled "B") to illiustrate the short-run effects of this pollicy. Suppose that now, after a period of 3% inflation, households and firms begin to expect that the inflation rate will persist at the level of 3%. On the previous graph, use the purple line (diamond symbol) to draw SRPC2, the short-run Phillips curve that is consistent with these expectations, assuming that it is parallet to SRPC1. Finally, using the orange point (square symbol labeled " c ), indicate on the previous graph the new, fong-run equilibrium for this economy. The inflation rate at point C is the inflation rate at point A, and the unemployment rate at point C is unemployment rate at point A. Was the central bank able to achleve its goal of lowering inflation? No, because the central bank cannot affect the inflation rate through monetary policy. Yes, the central bank's policy successfully reduced inflation in both the short run and the long run. Yes, but only in the short run; in the long run, inflation returned to its natural rate. Now, suppose that the public fully anticipates the central bank's decision to decrease the money supply. Assume the public also believes that the monetary authority is firmly committed to carrying out this policy. According to rational expectations theory, when the economy is in long-run equilibrium, a fully anticipated decrease in the money supply will cause the economy to move, on the previous Phillips curve graph. In this case, rational expectations theory predicts that the fully anticipated decrease in the money supply will have the immediate effect of in the inflation rate and in the unemployment rate