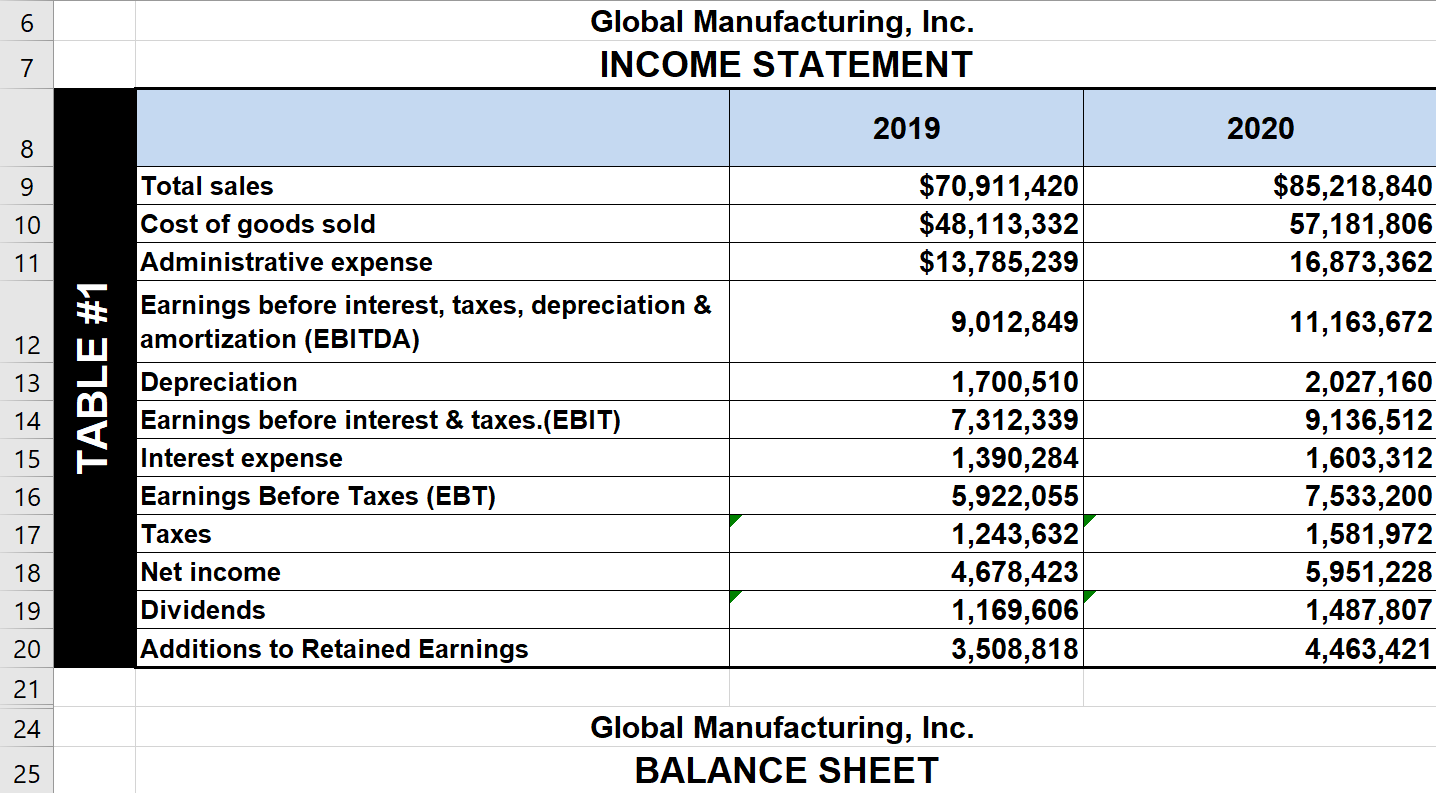
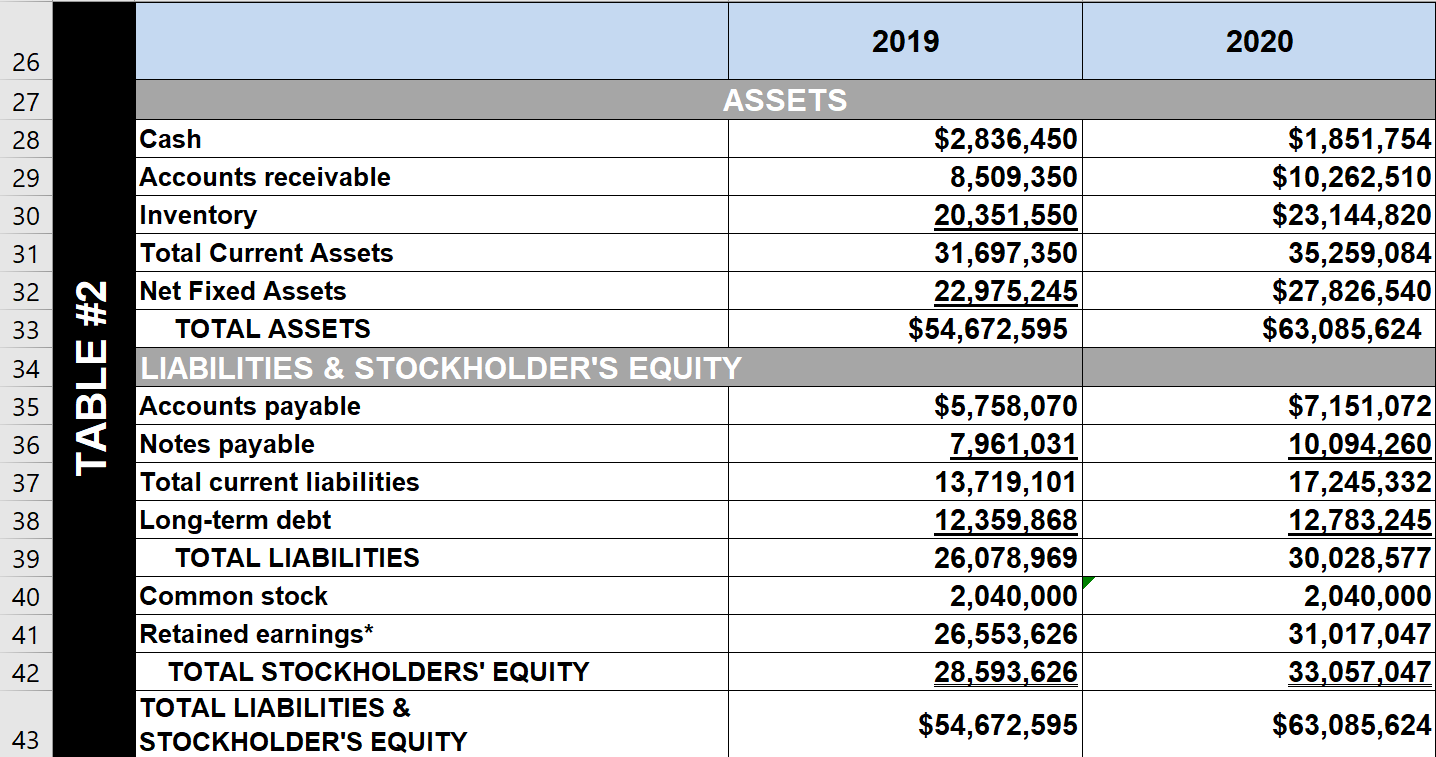
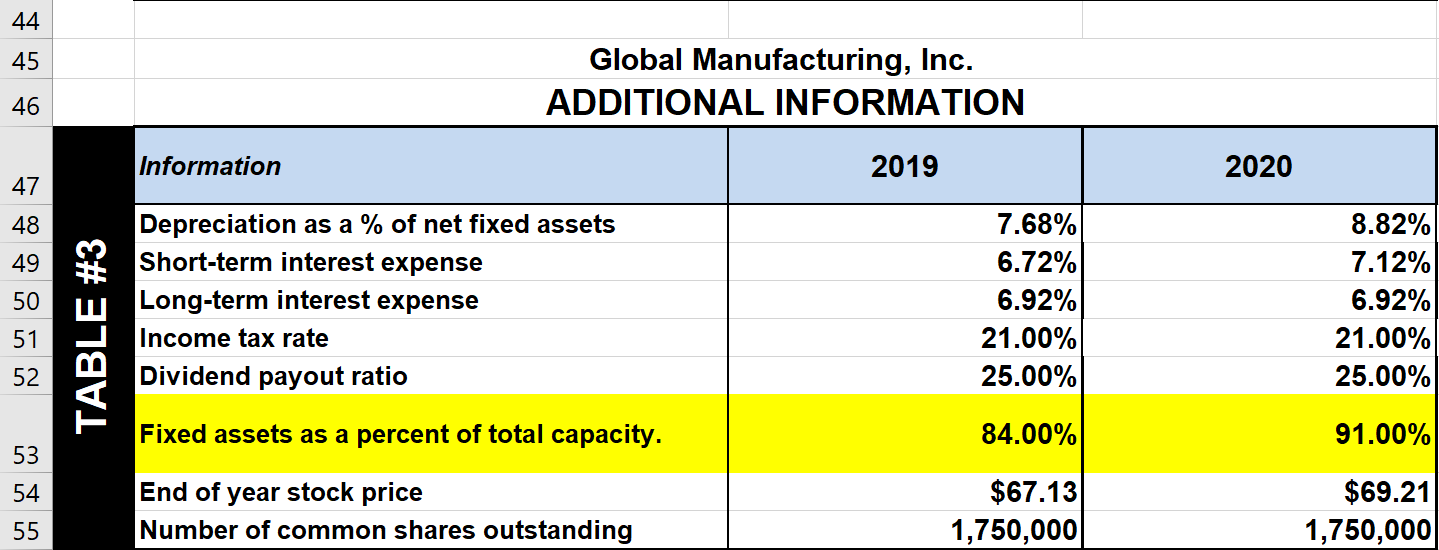
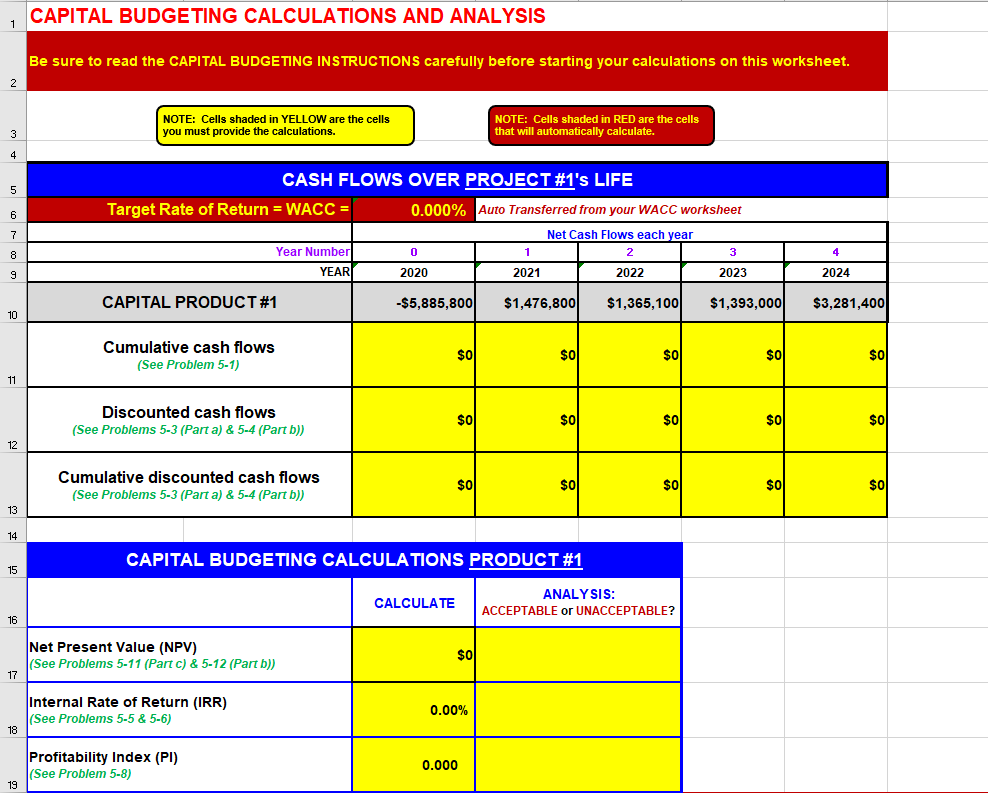
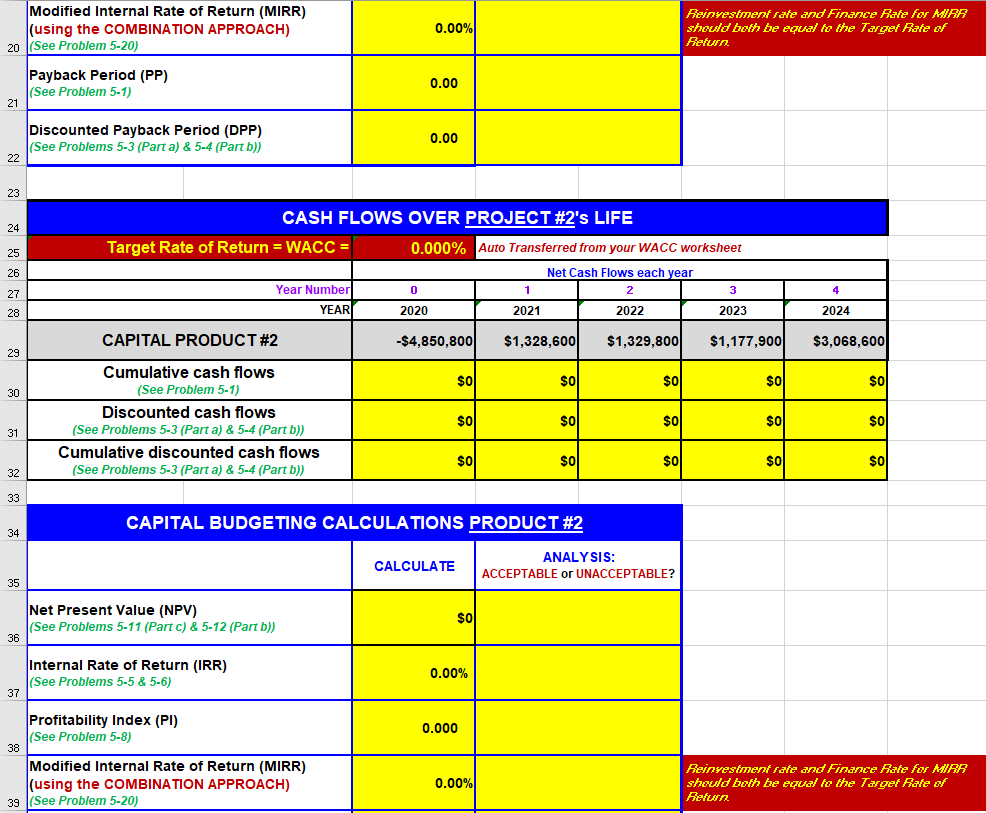
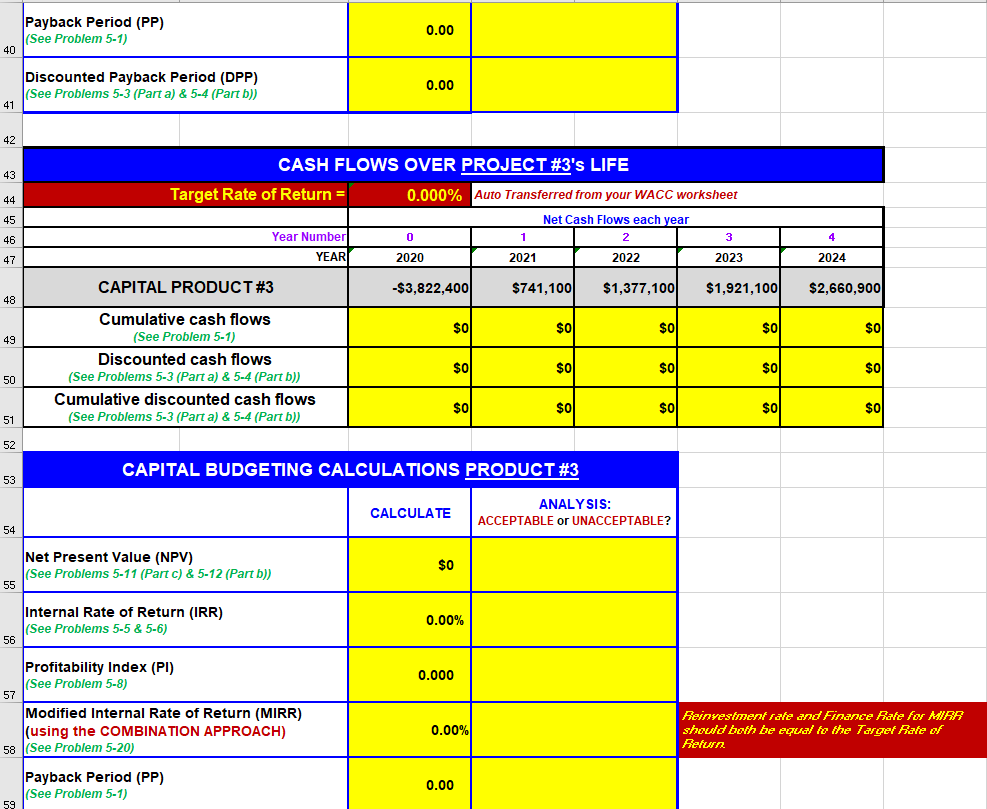
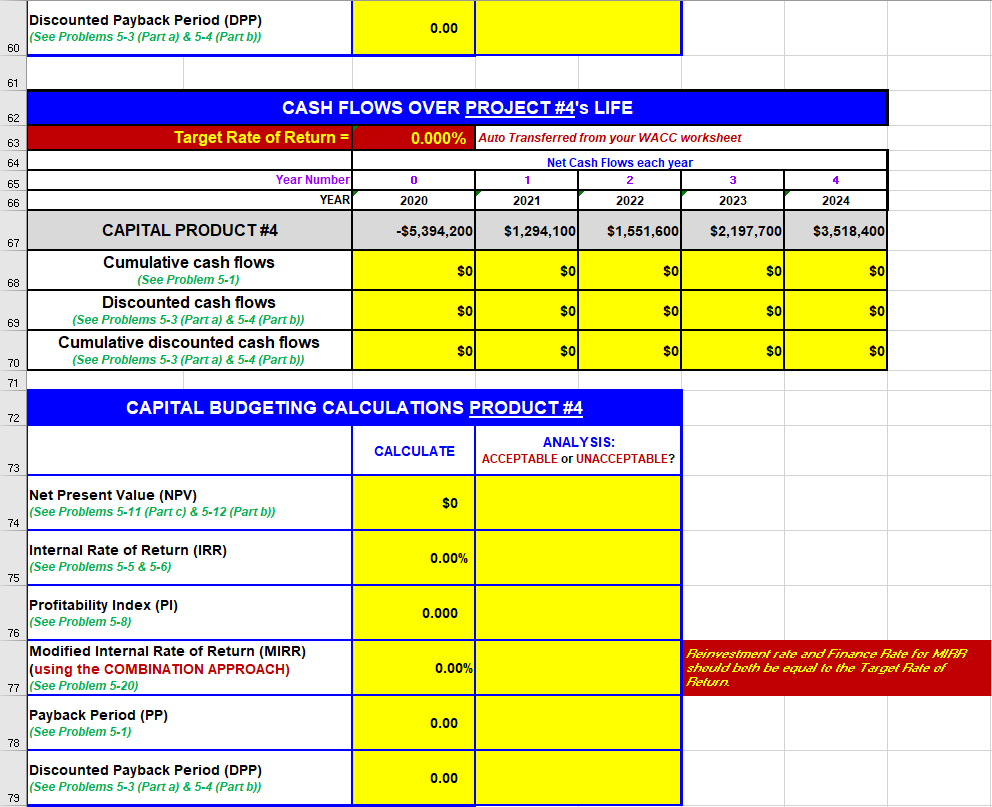
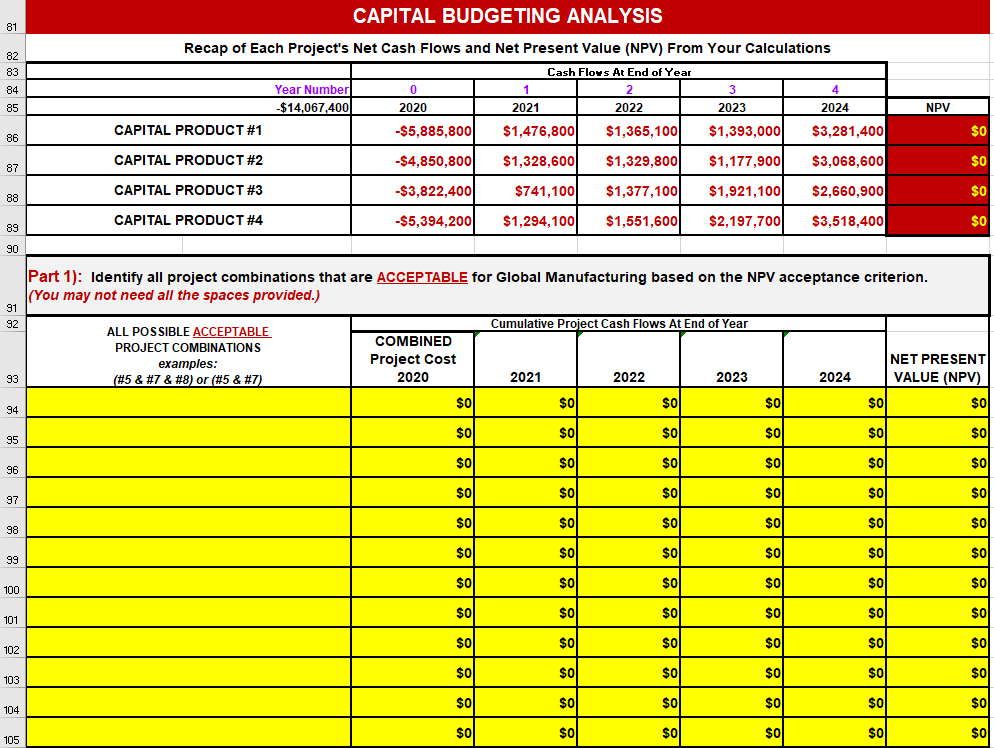
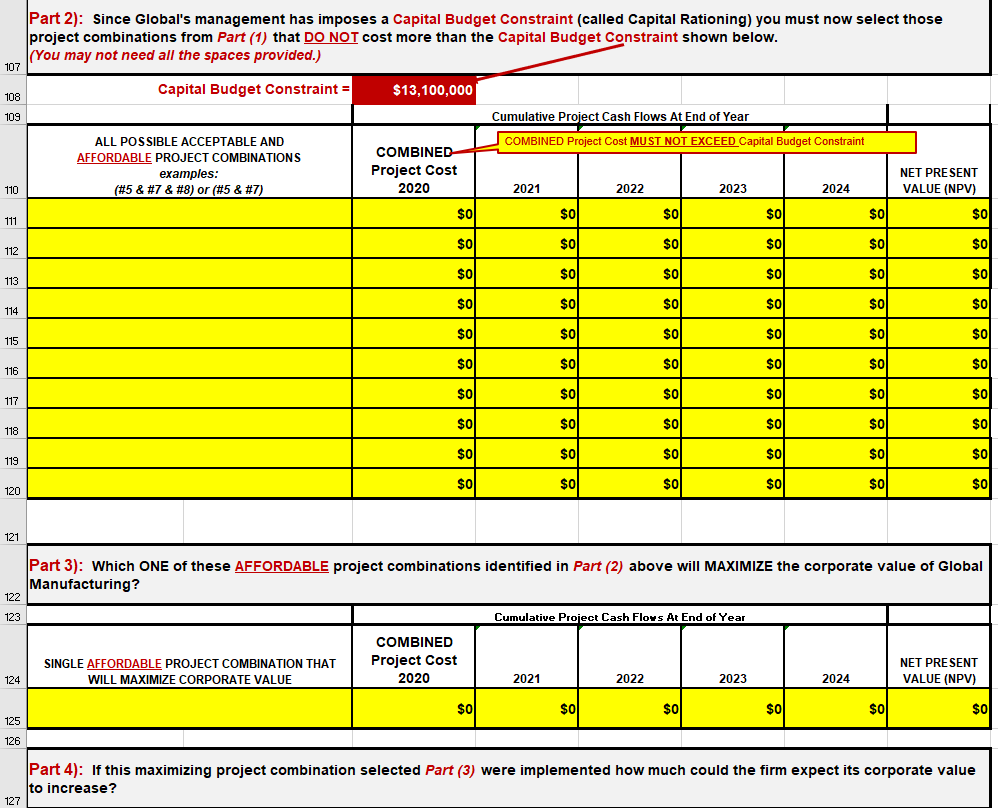

6 Global Manufacturing, Inc. INCOME STATEMENT 7 2019 2020 89 0 1 $70,911,420 $48,113,332 $13,785,239 $85,218,840 57,181,806 16,873,362 9,012,849 11,163,672 12 13 TABLE #1 14 Total sales Cost of goods sold Administrative expense Earnings before interest, taxes, depreciation & amortization (EBITDA) Depreciation Earnings before interest & taxes.(EBIT) Interest expense Earnings Before Taxes (EBT) Taxes Net income Dividends Additions to Retained Earnings 15 16 1,700,510 7,312,339 1,390,284 5,922,055 1,243,632 4,678,423 1,169,606 3,508,818 2,027,160 9,136,512 1,603,312 7,533,200 1,581,972 5,951,228 1,487,807 4,463,421 17 18 19 20 21 24 Global Manufacturing, Inc. BALANCE SHEET 25 2019 2020 26 27 28 29 30 $2,836,450 8,509,350 20,351,550 31,697,350 22,975,245 $54,672,595 $1,851,754 $10,262,510 $23,144,820 35,259,084 $27,826,540 $63,085,624 31 32 33 34 TABLE #2 35 ASSETS Cash Accounts receivable Inventory Total Current Assets Net Fixed Assets TOTAL ASSETS LIABILITIES & STOCKHOLDER'S EQUITY Accounts payable Notes payable Total current liabilities Long-term debt TOTAL LIABILITIES Common stock Retained earnings* TOTAL STOCKHOLDERS' EQUITY TOTAL LIABILITIES & STOCKHOLDER'S EQUITY 36 37 38 $5,758,070 7,961,031 13,719,101 12,359,868 26,078,969 2,040,000 26,553,626 28,593,626 $7,151,072 10,094,260 17,245,332 12,783,245 30,028,577 2,040,000 31,017,047 33,057,047 39 40 41 42 $54,672,595 $63,085,624 43 44 45 Global Manufacturing, Inc. ADDITIONAL INFORMATION 46 Information 2019 2020 47 48 49 50 Depreciation as a % of net fixed assets Short-term interest expense Long-term interest expense Income tax rate Dividend payout ratio TABLE #3 7.68% 6.72% 6.92% 21.00% 25.00% 8.82% 7.12% 6.92% 21.00% 25.00% 51 52 Fixed assets as a percent of total capacity. 84.00% 91.00% 53 54 End of year stock price Number of common shares outstanding $67.13 1,750,000 $69.21 1,750,000 55 CAPITAL BUDGETING CALCULATIONS AND ANALYSIS 1 Be sure to read the CAPITAL BUDGETING INSTRUCTIONS carefully before starting your calculations on this worksheet. 2 NOTE: Cells shaded in YELLOW are the cells you must provide the calculations. NOTE: Cells shaded in RED are the cells that will automatically calculate. 3 4 5 6 CASH FLOWS OVER PROJECT #1's LIFE Target Rate of Return = WACC = 0.000% Auto Transferred from your WACC worksheet Net Cash Flows each year Year Number 0 2 3 YEAR 2020 2021 2022 2023 7 8 1 4 9 2024 CAPITAL PRODUCT #1 -$5,885,800 $1,476,8001 $1,365,100 $1,393,000) $3,281,400 10 Cumulative cash flows (See Problem 5-1) $0 $0 $0 $0 $0 11 Discounted cash flows (See Problems 5-3 (Parta) & 5-4 (Part b)) $0 $0 $0 $0 $0 12 Cumulative discounted cash flows (See Problems 5-3 (Parta) & 5-4 (Part b)) $0 $0 $0 $0 $0 13 14 CAPITAL BUDGETING CALCULATIONS PRODUCT #1 15 CALCULATE ANALYSIS: ACCEPTABLE or UNACCEPTABLE? 16 Net Present Value (NPV) (See Problems 5-11 (Part c) & 5-12 (Part b)) $0 17 Internal Rate of Return (IRR) (See Problems 5-5 & 5-6) 0.00% 18 Profitability Index (PI) (See Problem 5-8) 0.000 19 0.00% Reinvestment rate and Finance Rate for MIRA should both be equal to the Targer Bale of Return Modified Internal Rate of Return (MIRR) (using the COMBINATION APPROACH) 20 (See Problem 5-20) Payback period (PP) (See Problem 5-1) 21 0.00 Discounted Payback Period (DPP) (See Problems 5-3 (Parta) & 5-4 (Part b)) 22 0.00 23 24 25 CASH FLOWS OVER PROJECT #2's LIFE Target Rate of Return = WACC = 0.000% Auto Transferred from your WACC worksheet Net Cash Flows each year Year Number 0 1 2 3 YEARI 2020 2021 2022 2023 26 27 4 28 2024 CAPITAL PRODUCT#2 -$4,850,800 $1,328,600 $1,329,800 $1,177,900) $3,068,600) 29 $0 $0 $0 $0 $0 30 Cumulative cash flows (See Problem 5-1) Discounted cash flows (See Problems 5-3 (Parta) & 5-4 (Part b)) Cumulative discounted cash flows (See Problems 5-3 (Parta) & 5-4 (Part b)) $0 $0 $0 $0 $0 31 $0 $ $0 $0 $0 $0 32 33 CAPITAL BUDGETING CALCULATIONS PRODUCT #2 34 CALCULATE ANALYSIS: ACCEPTABLE or UNACCEPTABLE? 35 Net Present Value (NPV) (See Problems 5-11 (Part c) & 5-12 (Part b)) 36 $0 Internal Rate of Return (IRR) (See Problems 5-5 & 5-6) 0.00% 37 0.000 Profitability Index (PI) (See Problem 5-8) 38 Modified Internal Rate of Return (MIRR) (using the COMBINATION APPROACH) 39 (See Problem 5-20) 0.00% Beinvestment rate and Finance Rate for MAR should both be equal to the Target Rate of Return Payback Period (PP) I(See Problem 5-1) 40 0.00 Discounted Payback Period (DPP) (See Problems 5-3 (Part a) & 5-4 (Part b)) 0.00 41 42 43 44 CASH FLOWS OVER PROJECT #3's LIFE Target Rate of Return = 0.000% Auto Transferred from your WACC worksheet Net Cash Flows each year Year Number 0 1 2 YEAR 2020 2021 2022 2023 45 3 4 46 47 2024 CAPITAL PRODUCT#3 -$3,822,400 $741,100 $1,377,100 $1,921,100 $2,660,900 48 $ol $0 $0 $0 $ol 49 Cumulative cash flows (See Problem 5.1) Discounted cash flows (See Problems 5-3 (Parta) & 5-4 (Part b)) Cumulative discounted cash flows (See Problems 5-3 (Part a) & 5-4 (Part b)) $ol $0 $0 $0 $0 50 $0|| $0) $0 $0 $0 51 52 CAPITAL BUDGETING CALCULATIONS PRODUCT #3 53 CALCULATE ANALYSIS: ACCEPTABLE or UNACCEPTABLE? 54 Net Present Value (NPV) (See Problems 5-11 (Part c) & 5-12 (Part b)) 55 $0 Internal Rate of Return (IRR) (See Problems 5-5 & 5-6) 56 0.00% 0.000 Profitability Index (PI) (See Problem 5-8) 57 Modified Internal Rate of Return (MIRR) (using the COMBINATION APPROACH) 58 (See Problem 5-20) 0.00% Reinvestment rate and Finance Rale for MRR should both be equal to the Target Dale of Relun Payback period (PP) (See Problem 5-1) 59 0.00 Discounted Payback Period (DPP) (See Problems 5-3 (Parta) & 5-4 (Part b)) 60 0.00 61 62 63 CASH FLOWS OVER PROJECT #4's LIFE Target Rate of Return = 0.000% Auto Transferred from your WACC worksheet Net Cash Flows each year Year Number 0 1 2 3 YEAR 2020 2021 2022 2023 64 65 4. 66 2024 CAPITAL PRODUCT #4 -$5,394,200 $1,294,100 $1,551,600 $2,197,700 $ $3,518,400 67 $0 $0 $0 0 $0 $0 68 Cumulative cash flows (See Problem 5-1) Discounted cash flows (See Problems 5-3 (Part a) & 5-4 (Part b)) Cumulative discounted cash flows (See Problems 5-3 (Part a) & 5-4 (Part b)) $0 $0 $0 $0 $0 69 $ $0 $0 $0 $0 $0 70 71 CAPITAL BUDGETING CALCULATIONS PRODUCT #4 72 CALCULATE ANALYSIS: ACCEPTABLE or UNACCEPTABLE? 73 Net Present Value (NPV) (See Problems 5-11 (Part c) & 5-12 (Part b)) 74 $0 Internal Rate of Return (IRR) (See Problems 5-5 & 5-6) 75 0.00% Profitability Index (PI) (See Problem 5-8) 0.000 76 Modified Internal Rate of Return (MIRR) (using the COMBINATION APPROACH) 77 (See Problem 5-20) 0.00% Reinvestment sale and Finance Rate for MIRR should both be equal to the Targer Bale of Return Payback Period (PP) (See Problem 5-1) 78 0.00 Discounted Payback Period (DPP) (See Problems 5-3 (Parta) & 5-4 (Part b)) 79 0.00 81 82 83 CAPITAL BUDGETING ANALYSIS Recap of Each Project's Net Cash Flows and Net Present Value (NPV) From Your Calculations Cash Floys At End of Year Year Number 0 1 2 3 $14,067,400 2020 2021 2022 2023 2024 CAPITAL PRODUCT #1 -$5,885,800 $1,476,800 $1,365,100 $1,393,000) $3,281,400 84 4 85 NPV $0 86 CAPITAL PRODUCT #2 -$4,850,800 $1,328,6001 $1,329,800 87 $1,177,900 $3,068,600 $0 CAPITAL PRODUCT #3 -$3,822,400 $741,100 88 $1,377,100 $1,921,100 $2,660,900 $0 CAPITAL PRODUCT #4 -$5,394,200 $1,294,100 $1,551,600 $2,197,700 $3,518,400 89 $0 90 Part 1): Identify all project combinations that are ACCEPTABLE for Global Manufacturing based on the NPV acceptance criterion. (You may not need all the spaces provided.) * 91 92 Cumulative Project Cash Flows At End of Year ALL POSSIBLE ACCEPTABLE PROJECT COMBINATIONS examples: (#5 & #7 & #8) or (#5 & #7) COMBINED Project Cost 2020 NET PRESENT VALUE (NPV) 93 2021 2022 2023 2024 $0 $0 $ $0 $0 $0 $0 94 $ol $0 $ol $0 $0 95 $0 $0 ) SO $0) $0 $0 ) $0 96 97 $0 $0 $0) $0 $0 $0 $o $0 $0 98 $0 $0 $0 $0 $0 $0 $0 $0 $0 99 $0 $0 $0 $0 $0 $0 100 $0 $ol $0 $0 $0 101 $0 $0 $0 $0 $0 $0 $0 102 $0 $0 $0 $ol $0 $0 103 104 $0 $0 $0) $01 $0 $ol $0 $0 $0 $0 $0 SO 105 Part 2): Since Global's management has imposes a Capital Budget Constraint (called Capital Rationing) you must now select those project combinations from Part (1) that DO NOT cost more than the Capital Budget Constraint shown below. (You may not need all the spaces provided.) 107 Capital Budget Constraint $13,100,000 108 109 Cumulative Project Cash Flows At End of Year COMBINED Project Cost MUST NOT EXCEED Capital Budget Constraint ALL POSSIBLE ACCEPTABLE AND AFFORDABLE PROJECT COMBINATIONS examples: (#5 & #7 & #8) or (#5 & #7) COMBINED Project Cost 2020 NET PRESENT VALUE (NPV) 110 2021 2022 2023 2024 $0 $0 $0 $0 $0 $0 111 $0 $0 $0 $0 $0 $0 112 $0 $0 $0 $0 $0 $0 113 $0 $0 $0 $0 $0 $0 114 $0 $ $0 $0 $ $0 115 $0 $0 $0 $0 $0 $0 $0 $0 116 $0 $0 $0 $0 $0 $0 117 $0 $0 $0 $0 $0 $0 118 $0 $0 $0 $0 $0 $0 119 $0 $0 $0 $0 $0 $0 120 121 Part 3): Which ONE of these AFFORDABLE project combinations identified in Part (2) above will MAXIMIZE the corporate value of Global Manufacturing? 122 123 Cumulative Project Cash Flows At End of Year SINGLE AFFORDABLE PROJECT COMBINATION THAT WILL MAXIMIZE CORPORATE VALUE COMBINED Project Cost 2020 124 2021 2022 NET PRESENT VALUE (NPV) 2023 2024 $0 $ol $ol $ol $0 $0 125 126 Part 4): If this maximizing project combination selected Part (3) were implemented how much could the firm expect its corporate value to increase? 127 128 Expected Increase in Corporate Value ($) = $0 129 130 6 Global Manufacturing, Inc. INCOME STATEMENT 7 2019 2020 89 0 1 $70,911,420 $48,113,332 $13,785,239 $85,218,840 57,181,806 16,873,362 9,012,849 11,163,672 12 13 TABLE #1 14 Total sales Cost of goods sold Administrative expense Earnings before interest, taxes, depreciation & amortization (EBITDA) Depreciation Earnings before interest & taxes.(EBIT) Interest expense Earnings Before Taxes (EBT) Taxes Net income Dividends Additions to Retained Earnings 15 16 1,700,510 7,312,339 1,390,284 5,922,055 1,243,632 4,678,423 1,169,606 3,508,818 2,027,160 9,136,512 1,603,312 7,533,200 1,581,972 5,951,228 1,487,807 4,463,421 17 18 19 20 21 24 Global Manufacturing, Inc. BALANCE SHEET 25 2019 2020 26 27 28 29 30 $2,836,450 8,509,350 20,351,550 31,697,350 22,975,245 $54,672,595 $1,851,754 $10,262,510 $23,144,820 35,259,084 $27,826,540 $63,085,624 31 32 33 34 TABLE #2 35 ASSETS Cash Accounts receivable Inventory Total Current Assets Net Fixed Assets TOTAL ASSETS LIABILITIES & STOCKHOLDER'S EQUITY Accounts payable Notes payable Total current liabilities Long-term debt TOTAL LIABILITIES Common stock Retained earnings* TOTAL STOCKHOLDERS' EQUITY TOTAL LIABILITIES & STOCKHOLDER'S EQUITY 36 37 38 $5,758,070 7,961,031 13,719,101 12,359,868 26,078,969 2,040,000 26,553,626 28,593,626 $7,151,072 10,094,260 17,245,332 12,783,245 30,028,577 2,040,000 31,017,047 33,057,047 39 40 41 42 $54,672,595 $63,085,624 43 44 45 Global Manufacturing, Inc. ADDITIONAL INFORMATION 46 Information 2019 2020 47 48 49 50 Depreciation as a % of net fixed assets Short-term interest expense Long-term interest expense Income tax rate Dividend payout ratio TABLE #3 7.68% 6.72% 6.92% 21.00% 25.00% 8.82% 7.12% 6.92% 21.00% 25.00% 51 52 Fixed assets as a percent of total capacity. 84.00% 91.00% 53 54 End of year stock price Number of common shares outstanding $67.13 1,750,000 $69.21 1,750,000 55 CAPITAL BUDGETING CALCULATIONS AND ANALYSIS 1 Be sure to read the CAPITAL BUDGETING INSTRUCTIONS carefully before starting your calculations on this worksheet. 2 NOTE: Cells shaded in YELLOW are the cells you must provide the calculations. NOTE: Cells shaded in RED are the cells that will automatically calculate. 3 4 5 6 CASH FLOWS OVER PROJECT #1's LIFE Target Rate of Return = WACC = 0.000% Auto Transferred from your WACC worksheet Net Cash Flows each year Year Number 0 2 3 YEAR 2020 2021 2022 2023 7 8 1 4 9 2024 CAPITAL PRODUCT #1 -$5,885,800 $1,476,8001 $1,365,100 $1,393,000) $3,281,400 10 Cumulative cash flows (See Problem 5-1) $0 $0 $0 $0 $0 11 Discounted cash flows (See Problems 5-3 (Parta) & 5-4 (Part b)) $0 $0 $0 $0 $0 12 Cumulative discounted cash flows (See Problems 5-3 (Parta) & 5-4 (Part b)) $0 $0 $0 $0 $0 13 14 CAPITAL BUDGETING CALCULATIONS PRODUCT #1 15 CALCULATE ANALYSIS: ACCEPTABLE or UNACCEPTABLE? 16 Net Present Value (NPV) (See Problems 5-11 (Part c) & 5-12 (Part b)) $0 17 Internal Rate of Return (IRR) (See Problems 5-5 & 5-6) 0.00% 18 Profitability Index (PI) (See Problem 5-8) 0.000 19 0.00% Reinvestment rate and Finance Rate for MIRA should both be equal to the Targer Bale of Return Modified Internal Rate of Return (MIRR) (using the COMBINATION APPROACH) 20 (See Problem 5-20) Payback period (PP) (See Problem 5-1) 21 0.00 Discounted Payback Period (DPP) (See Problems 5-3 (Parta) & 5-4 (Part b)) 22 0.00 23 24 25 CASH FLOWS OVER PROJECT #2's LIFE Target Rate of Return = WACC = 0.000% Auto Transferred from your WACC worksheet Net Cash Flows each year Year Number 0 1 2 3 YEARI 2020 2021 2022 2023 26 27 4 28 2024 CAPITAL PRODUCT#2 -$4,850,800 $1,328,600 $1,329,800 $1,177,900) $3,068,600) 29 $0 $0 $0 $0 $0 30 Cumulative cash flows (See Problem 5-1) Discounted cash flows (See Problems 5-3 (Parta) & 5-4 (Part b)) Cumulative discounted cash flows (See Problems 5-3 (Parta) & 5-4 (Part b)) $0 $0 $0 $0 $0 31 $0 $ $0 $0 $0 $0 32 33 CAPITAL BUDGETING CALCULATIONS PRODUCT #2 34 CALCULATE ANALYSIS: ACCEPTABLE or UNACCEPTABLE? 35 Net Present Value (NPV) (See Problems 5-11 (Part c) & 5-12 (Part b)) 36 $0 Internal Rate of Return (IRR) (See Problems 5-5 & 5-6) 0.00% 37 0.000 Profitability Index (PI) (See Problem 5-8) 38 Modified Internal Rate of Return (MIRR) (using the COMBINATION APPROACH) 39 (See Problem 5-20) 0.00% Beinvestment rate and Finance Rate for MAR should both be equal to the Target Rate of Return Payback Period (PP) I(See Problem 5-1) 40 0.00 Discounted Payback Period (DPP) (See Problems 5-3 (Part a) & 5-4 (Part b)) 0.00 41 42 43 44 CASH FLOWS OVER PROJECT #3's LIFE Target Rate of Return = 0.000% Auto Transferred from your WACC worksheet Net Cash Flows each year Year Number 0 1 2 YEAR 2020 2021 2022 2023 45 3 4 46 47 2024 CAPITAL PRODUCT#3 -$3,822,400 $741,100 $1,377,100 $1,921,100 $2,660,900 48 $ol $0 $0 $0 $ol 49 Cumulative cash flows (See Problem 5.1) Discounted cash flows (See Problems 5-3 (Parta) & 5-4 (Part b)) Cumulative discounted cash flows (See Problems 5-3 (Part a) & 5-4 (Part b)) $ol $0 $0 $0 $0 50 $0|| $0) $0 $0 $0 51 52 CAPITAL BUDGETING CALCULATIONS PRODUCT #3 53 CALCULATE ANALYSIS: ACCEPTABLE or UNACCEPTABLE? 54 Net Present Value (NPV) (See Problems 5-11 (Part c) & 5-12 (Part b)) 55 $0 Internal Rate of Return (IRR) (See Problems 5-5 & 5-6) 56 0.00% 0.000 Profitability Index (PI) (See Problem 5-8) 57 Modified Internal Rate of Return (MIRR) (using the COMBINATION APPROACH) 58 (See Problem 5-20) 0.00% Reinvestment rate and Finance Rale for MRR should both be equal to the Target Dale of Relun Payback period (PP) (See Problem 5-1) 59 0.00 Discounted Payback Period (DPP) (See Problems 5-3 (Parta) & 5-4 (Part b)) 60 0.00 61 62 63 CASH FLOWS OVER PROJECT #4's LIFE Target Rate of Return = 0.000% Auto Transferred from your WACC worksheet Net Cash Flows each year Year Number 0 1 2 3 YEAR 2020 2021 2022 2023 64 65 4. 66 2024 CAPITAL PRODUCT #4 -$5,394,200 $1,294,100 $1,551,600 $2,197,700 $ $3,518,400 67 $0 $0 $0 0 $0 $0 68 Cumulative cash flows (See Problem 5-1) Discounted cash flows (See Problems 5-3 (Part a) & 5-4 (Part b)) Cumulative discounted cash flows (See Problems 5-3 (Part a) & 5-4 (Part b)) $0 $0 $0 $0 $0 69 $ $0 $0 $0 $0 $0 70 71 CAPITAL BUDGETING CALCULATIONS PRODUCT #4 72 CALCULATE ANALYSIS: ACCEPTABLE or UNACCEPTABLE? 73 Net Present Value (NPV) (See Problems 5-11 (Part c) & 5-12 (Part b)) 74 $0 Internal Rate of Return (IRR) (See Problems 5-5 & 5-6) 75 0.00% Profitability Index (PI) (See Problem 5-8) 0.000 76 Modified Internal Rate of Return (MIRR) (using the COMBINATION APPROACH) 77 (See Problem 5-20) 0.00% Reinvestment sale and Finance Rate for MIRR should both be equal to the Targer Bale of Return Payback Period (PP) (See Problem 5-1) 78 0.00 Discounted Payback Period (DPP) (See Problems 5-3 (Parta) & 5-4 (Part b)) 79 0.00 81 82 83 CAPITAL BUDGETING ANALYSIS Recap of Each Project's Net Cash Flows and Net Present Value (NPV) From Your Calculations Cash Floys At End of Year Year Number 0 1 2 3 $14,067,400 2020 2021 2022 2023 2024 CAPITAL PRODUCT #1 -$5,885,800 $1,476,800 $1,365,100 $1,393,000) $3,281,400 84 4 85 NPV $0 86 CAPITAL PRODUCT #2 -$4,850,800 $1,328,6001 $1,329,800 87 $1,177,900 $3,068,600 $0 CAPITAL PRODUCT #3 -$3,822,400 $741,100 88 $1,377,100 $1,921,100 $2,660,900 $0 CAPITAL PRODUCT #4 -$5,394,200 $1,294,100 $1,551,600 $2,197,700 $3,518,400 89 $0 90 Part 1): Identify all project combinations that are ACCEPTABLE for Global Manufacturing based on the NPV acceptance criterion. (You may not need all the spaces provided.) * 91 92 Cumulative Project Cash Flows At End of Year ALL POSSIBLE ACCEPTABLE PROJECT COMBINATIONS examples: (#5 & #7 & #8) or (#5 & #7) COMBINED Project Cost 2020 NET PRESENT VALUE (NPV) 93 2021 2022 2023 2024 $0 $0 $ $0 $0 $0 $0 94 $ol $0 $ol $0 $0 95 $0 $0 ) SO $0) $0 $0 ) $0 96 97 $0 $0 $0) $0 $0 $0 $o $0 $0 98 $0 $0 $0 $0 $0 $0 $0 $0 $0 99 $0 $0 $0 $0 $0 $0 100 $0 $ol $0 $0 $0 101 $0 $0 $0 $0 $0 $0 $0 102 $0 $0 $0 $ol $0 $0 103 104 $0 $0 $0) $01 $0 $ol $0 $0 $0 $0 $0 SO 105 Part 2): Since Global's management has imposes a Capital Budget Constraint (called Capital Rationing) you must now select those project combinations from Part (1) that DO NOT cost more than the Capital Budget Constraint shown below. (You may not need all the spaces provided.) 107 Capital Budget Constraint $13,100,000 108 109 Cumulative Project Cash Flows At End of Year COMBINED Project Cost MUST NOT EXCEED Capital Budget Constraint ALL POSSIBLE ACCEPTABLE AND AFFORDABLE PROJECT COMBINATIONS examples: (#5 & #7 & #8) or (#5 & #7) COMBINED Project Cost 2020 NET PRESENT VALUE (NPV) 110 2021 2022 2023 2024 $0 $0 $0 $0 $0 $0 111 $0 $0 $0 $0 $0 $0 112 $0 $0 $0 $0 $0 $0 113 $0 $0 $0 $0 $0 $0 114 $0 $ $0 $0 $ $0 115 $0 $0 $0 $0 $0 $0 $0 $0 116 $0 $0 $0 $0 $0 $0 117 $0 $0 $0 $0 $0 $0 118 $0 $0 $0 $0 $0 $0 119 $0 $0 $0 $0 $0 $0 120 121 Part 3): Which ONE of these AFFORDABLE project combinations identified in Part (2) above will MAXIMIZE the corporate value of Global Manufacturing? 122 123 Cumulative Project Cash Flows At End of Year SINGLE AFFORDABLE PROJECT COMBINATION THAT WILL MAXIMIZE CORPORATE VALUE COMBINED Project Cost 2020 124 2021 2022 NET PRESENT VALUE (NPV) 2023 2024 $0 $ol $ol $ol $0 $0 125 126 Part 4): If this maximizing project combination selected Part (3) were implemented how much could the firm expect its corporate value to increase? 127 128 Expected Increase in Corporate Value ($) = $0 129 130


