

Answered step by step
Verified Expert Solution
Question
1 Approved Answer
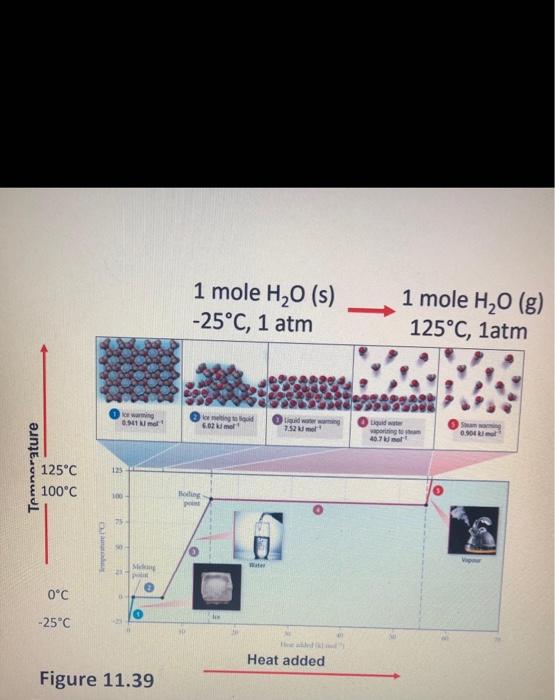
6. Make a plot of the heat transfer and temperature change for the system described in Question 5. Plot the temperature on the y axis

Step by Step Solution
There are 3 Steps involved in it
Step: 1

Get Instant Access to Expert-Tailored Solutions
See step-by-step solutions with expert insights and AI powered tools for academic success
Step: 2

Step: 3
Ace Your Homework with AI
Get the answers you need in no time with our AI-driven, step-by-step assistance
Get Started
General Chemisty
Authors: John E. McMurry, Robert C. Fay
2nd Edition
1269962175, 978-1269962179