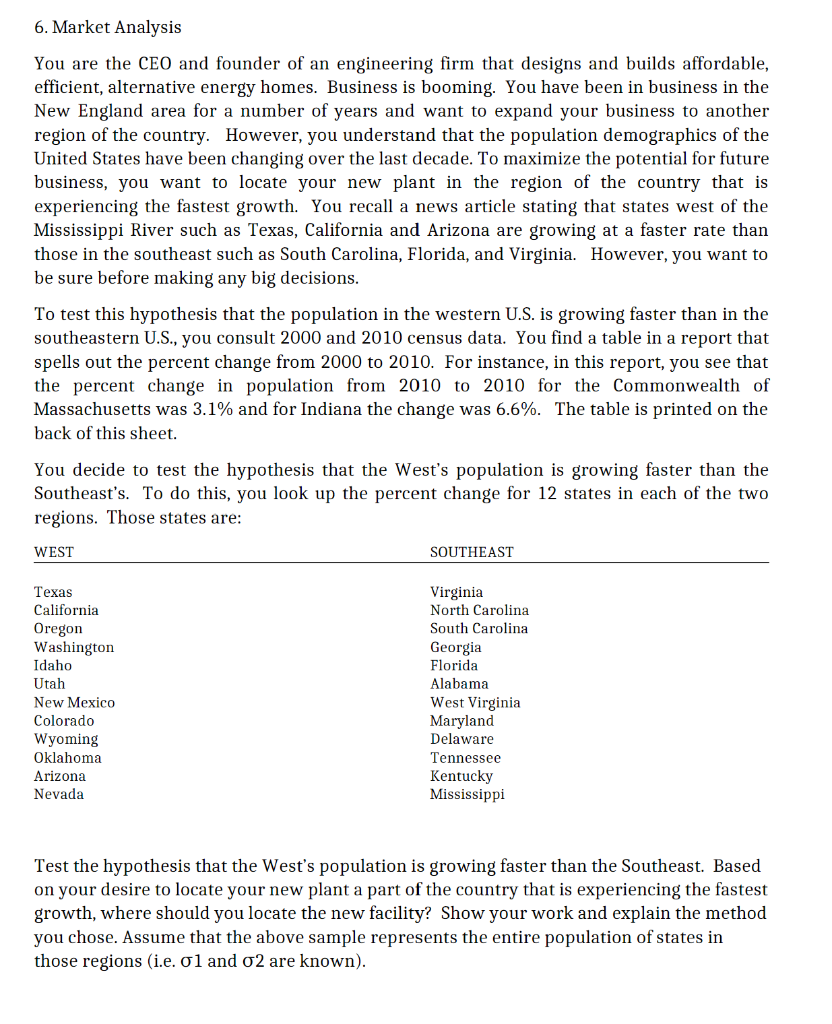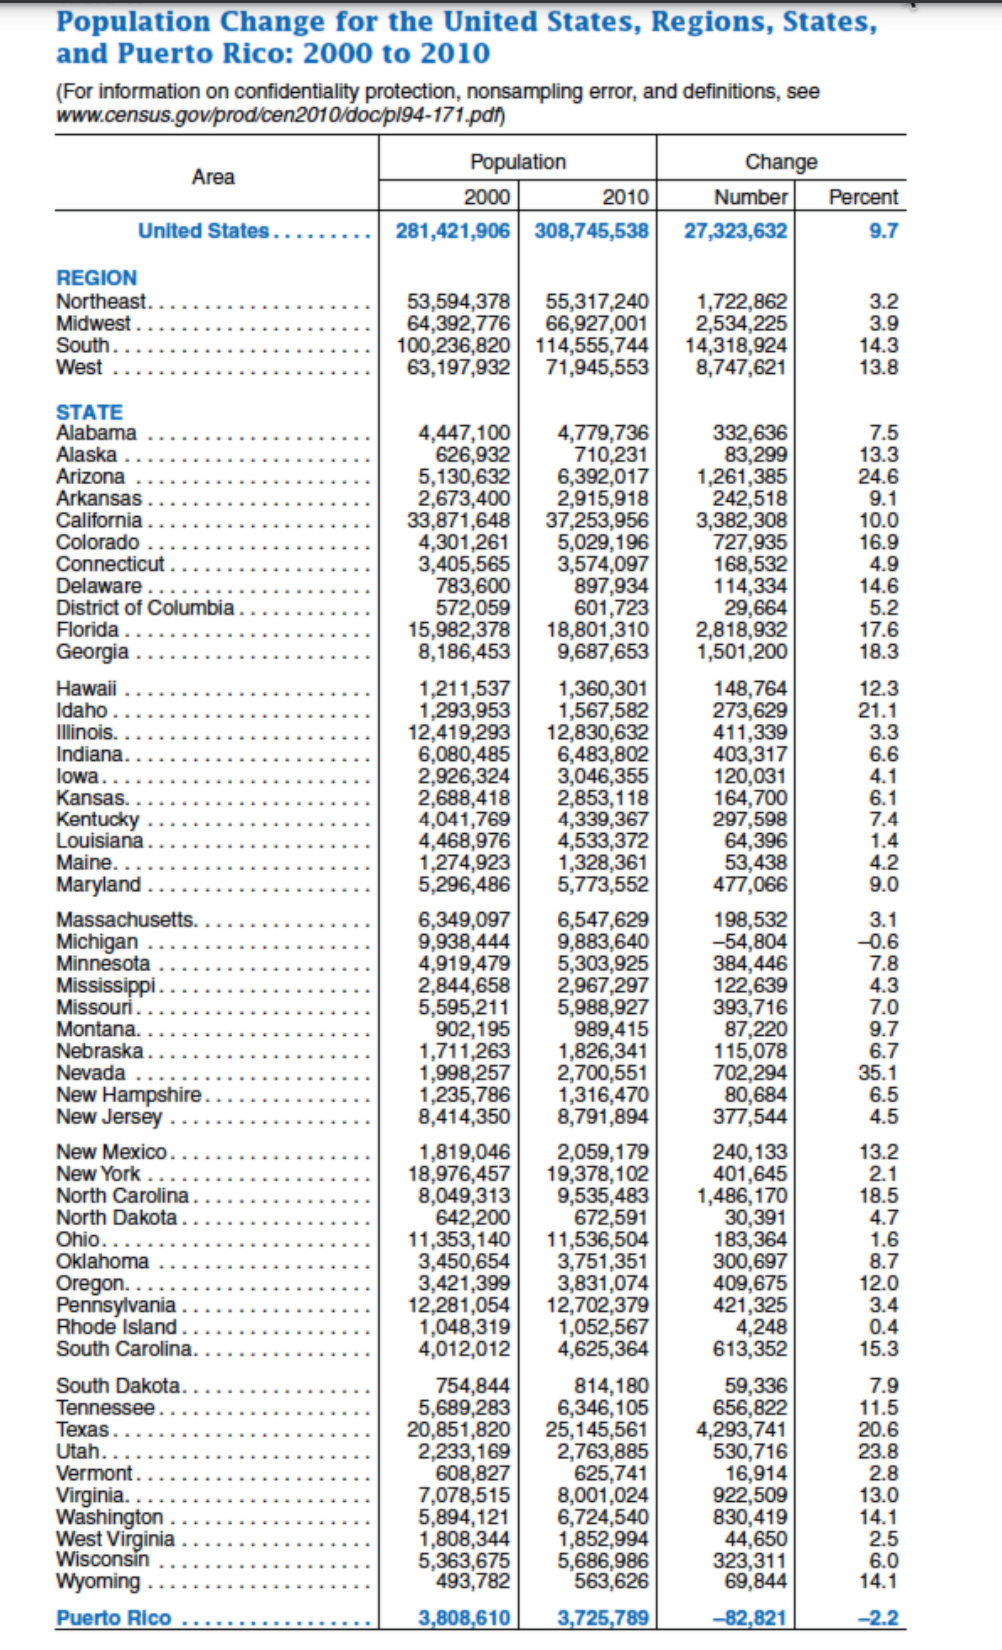

6. Market Analysis You are the CEO and founder of an engineering firm that designs and builds affordable, efficient, alternative energy homes. Business is booming. You have been in business in the New England area for a number of years and want to expand your business to another region of the country. However, you understand that the population demographics of the United States have been changing over the last decade. To maximize the potential for future business, you want to locate your new plant in the region of the country that is experiencing the fastest growth. You recall a news article stating that states west of the Mississippi River such as Texas, California and Arizona are growing at a faster rate than those in the southeast such as South Carolina, Florida, and Virginia. However, you want to be sure before making any big decisions. To test this hypothesis that the population in the western U.S. is growing faster than in the southeastern U.S., you consult 2000 and 2010 census data. You find a table in a report that spells out the percent change from 2000 to 2010. For instance, in this report, you see that the percent change in population from 2010 2010 for the Commonwealth of Massachusetts was 3.1% and for Indiana the change was 6.6%. The table is printed on the back of this sheet. You decide to test the hypothesis that the West's population is growing faster than the Southeast's. To do this, you look up the percent change for 12 states in each of the two regions. Those states are: WEST SOUTHEAST Texas California Oregon Washington Idaho Utah New Mexico Colorado Wyoming Oklahoma Arizona Nevada Virginia North Carolina South Carolina Georgia Florida Alabama West Virginia Maryland Delaware Tennessee Kentucky Mississippi Test the hypothesis that the West's population is growing faster than the Southeast. Based on your desire to locate your new plant a part of the country that is experiencing the fastest growth, where should you locate the new facility? Show your work and explain the method you chose. Assume that the above sample represents the entire population of states in those regions (i.e. ol and 02 are known). Population Change for the United States, Regions, States, and Puerto Rico: 2000 to 2010 (For information on confidentiality protection, nonsampling error, and definitions, see www.census.gov/prod/cen2010/doc/p/94-171.pdf) Area Population Change 2000 2010 Number Percent United States. 281,421,906 308,745,538 27,323,632 9.7 REGION Northeast. Midwest South... West 53,594,378 55,317,240 64,392,776 66,927,001 100,236,820 114,555,744 63,197,932 71,945,553 1,722,862 2,534,225 14,318,924 8,747,621 3.2 3.9 14.3 13.8 7.5 13.3 24.6 9.1 10.0 16.9 4.9 14.6 5.2 17.6 18.3 12.3 21.1 3.3 6.6 4.1 6.1 7.4 1.4 4.2 9.0 STATE Alabama Alaska Arizona Arkansas California Colorado Connecticut Delaware District of Columbia Florida Georgia Hawaii Idaho Illinois. Indiana. lowa. Kansas. Kentucky Louisiana Maine.. Maryland Massachusetts. Michigan Minnesota Mississippi. Missouri. Montana. Nebraska Nevada New Hampshire. New Jersey New Mexico New York .. North Carolina North Dakota. Ohio... Oklahoma Oregon. Pennsylvania Rhode Island South Carolina. South Dakota.. Tennessee Texas. Utah. Vermont. Virginia Washington West Virginia Wisconsin Wyoming Puerto Rico 4,447,100 626,932 5,130,632 2,673,400 33,871,648 4,301,261 3,405,565 783,600 572,059 15,982,378 8,186,453 1,211,537 1,293,953 12,419,293 6,080,485 2,926,324 2,688,418 4,041,769 4,468,976 1,274,923 5,296,486 6,349,097 9,938,444 4,919,479 2,844,658 5,595,211 902,195 1,711,263 1,998,257 1,235,786 8,414,350 1,819,046 18,976,457 8,049,313 642,200 11,353,140 3,450,654 3,421,399 12,281,054 1,048,319 4,012,012 754,844 5,689,283 20,851,820 2,233,169 608,827 7,078,515 5,894,121 1,808,344 5,363,675 493,782 4,779,736 710,231 6,392,017 2,915,918 37,253,956 5,029, 196 3,574,097 897,934 601,723 18,801,310 9,687,653 1,360,301 1,567,582 12,830,632 6,483,802 3,046,355 2,853,118 4,339,367 4,533,372 1,328,361 5,773,552 6,547,629 9,883,640 5,303,925 2,967,297 5,988,927 989,415 1,826,341 2,700,551 1,316,470 8,791,894 2,059,179 19,378,102 9,535,483 672,591 11,536,504 3,751,351 3,831,074 12,702,379 1,052,567 4,625,364 814, 180 6,346,105 25,145,561 2,763,885 625,741 8,001,024 6,724,540 1,852,994 5,686,986 563,626 3,725,789 332,636 83,299 1,261,385 242,518 3,382,308 727,935 168,532 114,334 29,664 2,818,932 1,501,200 148,764 273,629 411,339 403,317 120,031 164,700 297,598 64,396 53,438 477,066 198,532 -54,804 384,446 122,639 393,716 87,220 115,078 702,294 80,684 377,544 240,133 401,645 1,486,170 30,391 183,364 300,697 409,675 421,325 4,248 613,352 59,336 656,822 4,293,741 530,716 16,914 922,509 830,419 44,650 323,311 69,844 -82,821 3.1 -0.6 7.8 4.3 7.0 9.7 6.7 35.1 6.5 4.5 13.2 2.1 18.5 4.7 1.6 8.7 12.0 3.4 0.4 15.3 7.9 11.5 20.6 23.8 2.8 13.0 14.1 2.5 6.0 14.1 3,808,610 -2.2 6. Market Analysis You are the CEO and founder of an engineering firm that designs and builds affordable, efficient, alternative energy homes. Business is booming. You have been in business in the New England area for a number of years and want to expand your business to another region of the country. However, you understand that the population demographics of the United States have been changing over the last decade. To maximize the potential for future business, you want to locate your new plant in the region of the country that is experiencing the fastest growth. You recall a news article stating that states west of the Mississippi River such as Texas, California and Arizona are growing at a faster rate than those in the southeast such as South Carolina, Florida, and Virginia. However, you want to be sure before making any big decisions. To test this hypothesis that the population in the western U.S. is growing faster than in the southeastern U.S., you consult 2000 and 2010 census data. You find a table in a report that spells out the percent change from 2000 to 2010. For instance, in this report, you see that the percent change in population from 2010 2010 for the Commonwealth of Massachusetts was 3.1% and for Indiana the change was 6.6%. The table is printed on the back of this sheet. You decide to test the hypothesis that the West's population is growing faster than the Southeast's. To do this, you look up the percent change for 12 states in each of the two regions. Those states are: WEST SOUTHEAST Texas California Oregon Washington Idaho Utah New Mexico Colorado Wyoming Oklahoma Arizona Nevada Virginia North Carolina South Carolina Georgia Florida Alabama West Virginia Maryland Delaware Tennessee Kentucky Mississippi Test the hypothesis that the West's population is growing faster than the Southeast. Based on your desire to locate your new plant a part of the country that is experiencing the fastest growth, where should you locate the new facility? Show your work and explain the method you chose. Assume that the above sample represents the entire population of states in those regions (i.e. ol and 02 are known). Population Change for the United States, Regions, States, and Puerto Rico: 2000 to 2010 (For information on confidentiality protection, nonsampling error, and definitions, see www.census.gov/prod/cen2010/doc/p/94-171.pdf) Area Population Change 2000 2010 Number Percent United States. 281,421,906 308,745,538 27,323,632 9.7 REGION Northeast. Midwest South... West 53,594,378 55,317,240 64,392,776 66,927,001 100,236,820 114,555,744 63,197,932 71,945,553 1,722,862 2,534,225 14,318,924 8,747,621 3.2 3.9 14.3 13.8 7.5 13.3 24.6 9.1 10.0 16.9 4.9 14.6 5.2 17.6 18.3 12.3 21.1 3.3 6.6 4.1 6.1 7.4 1.4 4.2 9.0 STATE Alabama Alaska Arizona Arkansas California Colorado Connecticut Delaware District of Columbia Florida Georgia Hawaii Idaho Illinois. Indiana. lowa. Kansas. Kentucky Louisiana Maine.. Maryland Massachusetts. Michigan Minnesota Mississippi. Missouri. Montana. Nebraska Nevada New Hampshire. New Jersey New Mexico New York .. North Carolina North Dakota. Ohio... Oklahoma Oregon. Pennsylvania Rhode Island South Carolina. South Dakota.. Tennessee Texas. Utah. Vermont. Virginia Washington West Virginia Wisconsin Wyoming Puerto Rico 4,447,100 626,932 5,130,632 2,673,400 33,871,648 4,301,261 3,405,565 783,600 572,059 15,982,378 8,186,453 1,211,537 1,293,953 12,419,293 6,080,485 2,926,324 2,688,418 4,041,769 4,468,976 1,274,923 5,296,486 6,349,097 9,938,444 4,919,479 2,844,658 5,595,211 902,195 1,711,263 1,998,257 1,235,786 8,414,350 1,819,046 18,976,457 8,049,313 642,200 11,353,140 3,450,654 3,421,399 12,281,054 1,048,319 4,012,012 754,844 5,689,283 20,851,820 2,233,169 608,827 7,078,515 5,894,121 1,808,344 5,363,675 493,782 4,779,736 710,231 6,392,017 2,915,918 37,253,956 5,029, 196 3,574,097 897,934 601,723 18,801,310 9,687,653 1,360,301 1,567,582 12,830,632 6,483,802 3,046,355 2,853,118 4,339,367 4,533,372 1,328,361 5,773,552 6,547,629 9,883,640 5,303,925 2,967,297 5,988,927 989,415 1,826,341 2,700,551 1,316,470 8,791,894 2,059,179 19,378,102 9,535,483 672,591 11,536,504 3,751,351 3,831,074 12,702,379 1,052,567 4,625,364 814, 180 6,346,105 25,145,561 2,763,885 625,741 8,001,024 6,724,540 1,852,994 5,686,986 563,626 3,725,789 332,636 83,299 1,261,385 242,518 3,382,308 727,935 168,532 114,334 29,664 2,818,932 1,501,200 148,764 273,629 411,339 403,317 120,031 164,700 297,598 64,396 53,438 477,066 198,532 -54,804 384,446 122,639 393,716 87,220 115,078 702,294 80,684 377,544 240,133 401,645 1,486,170 30,391 183,364 300,697 409,675 421,325 4,248 613,352 59,336 656,822 4,293,741 530,716 16,914 922,509 830,419 44,650 323,311 69,844 -82,821 3.1 -0.6 7.8 4.3 7.0 9.7 6.7 35.1 6.5 4.5 13.2 2.1 18.5 4.7 1.6 8.7 12.0 3.4 0.4 15.3 7.9 11.5 20.6 23.8 2.8 13.0 14.1 2.5 6.0 14.1 3,808,610 -2.2


