

Answered step by step
Verified Expert Solution
Question
1 Approved Answer
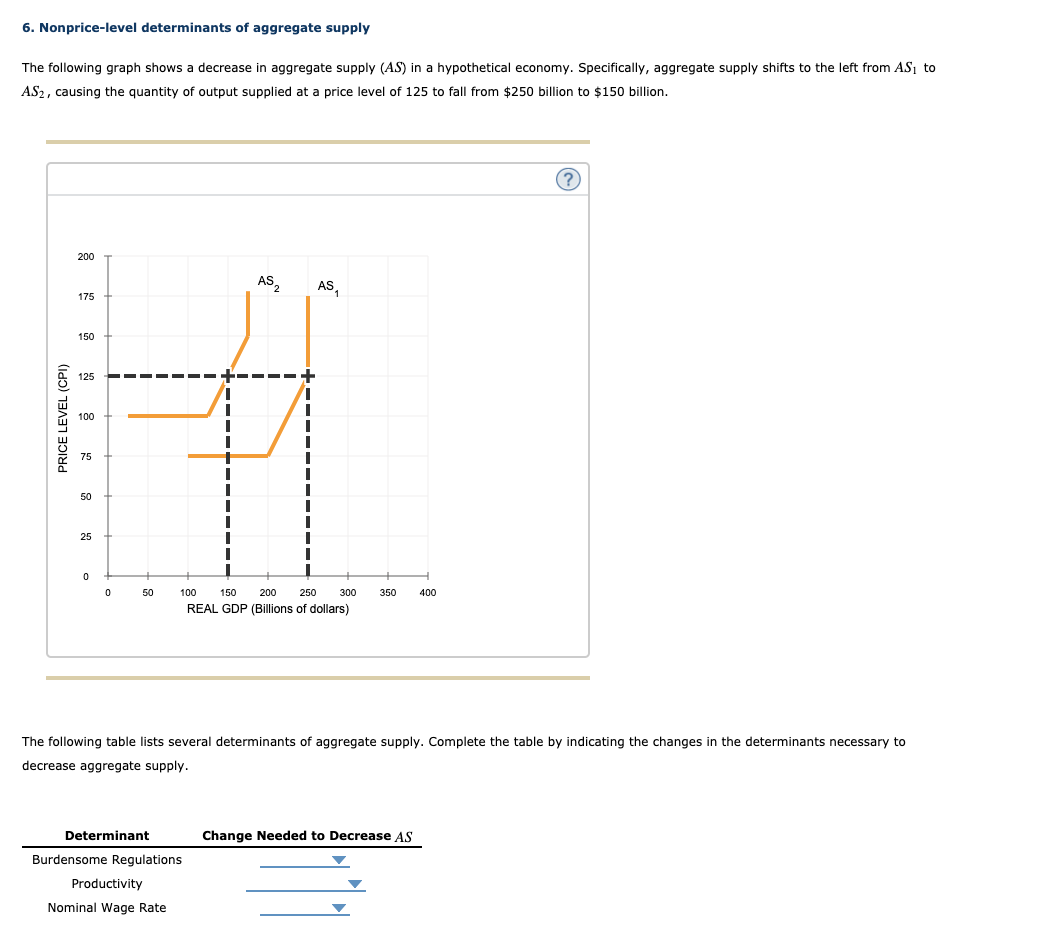
6. Nonprice-level determinants of aggregate supply The following graph shows a decrease in aggregate supply (AS) in a hypothetical economy. Specifically, aggregate supply shifts to
Step by Step Solution
There are 3 Steps involved in it
Step: 1

Get Instant Access with AI-Powered Solutions
See step-by-step solutions with expert insights and AI powered tools for academic success
Step: 2

Step: 3
Ace Your Homework with AI
Get the answers you need in no time with our AI-driven, step-by-step assistance
Get Started