Answered step by step
Verified Expert Solution
Link Copied!

Question

1 Approved Answer

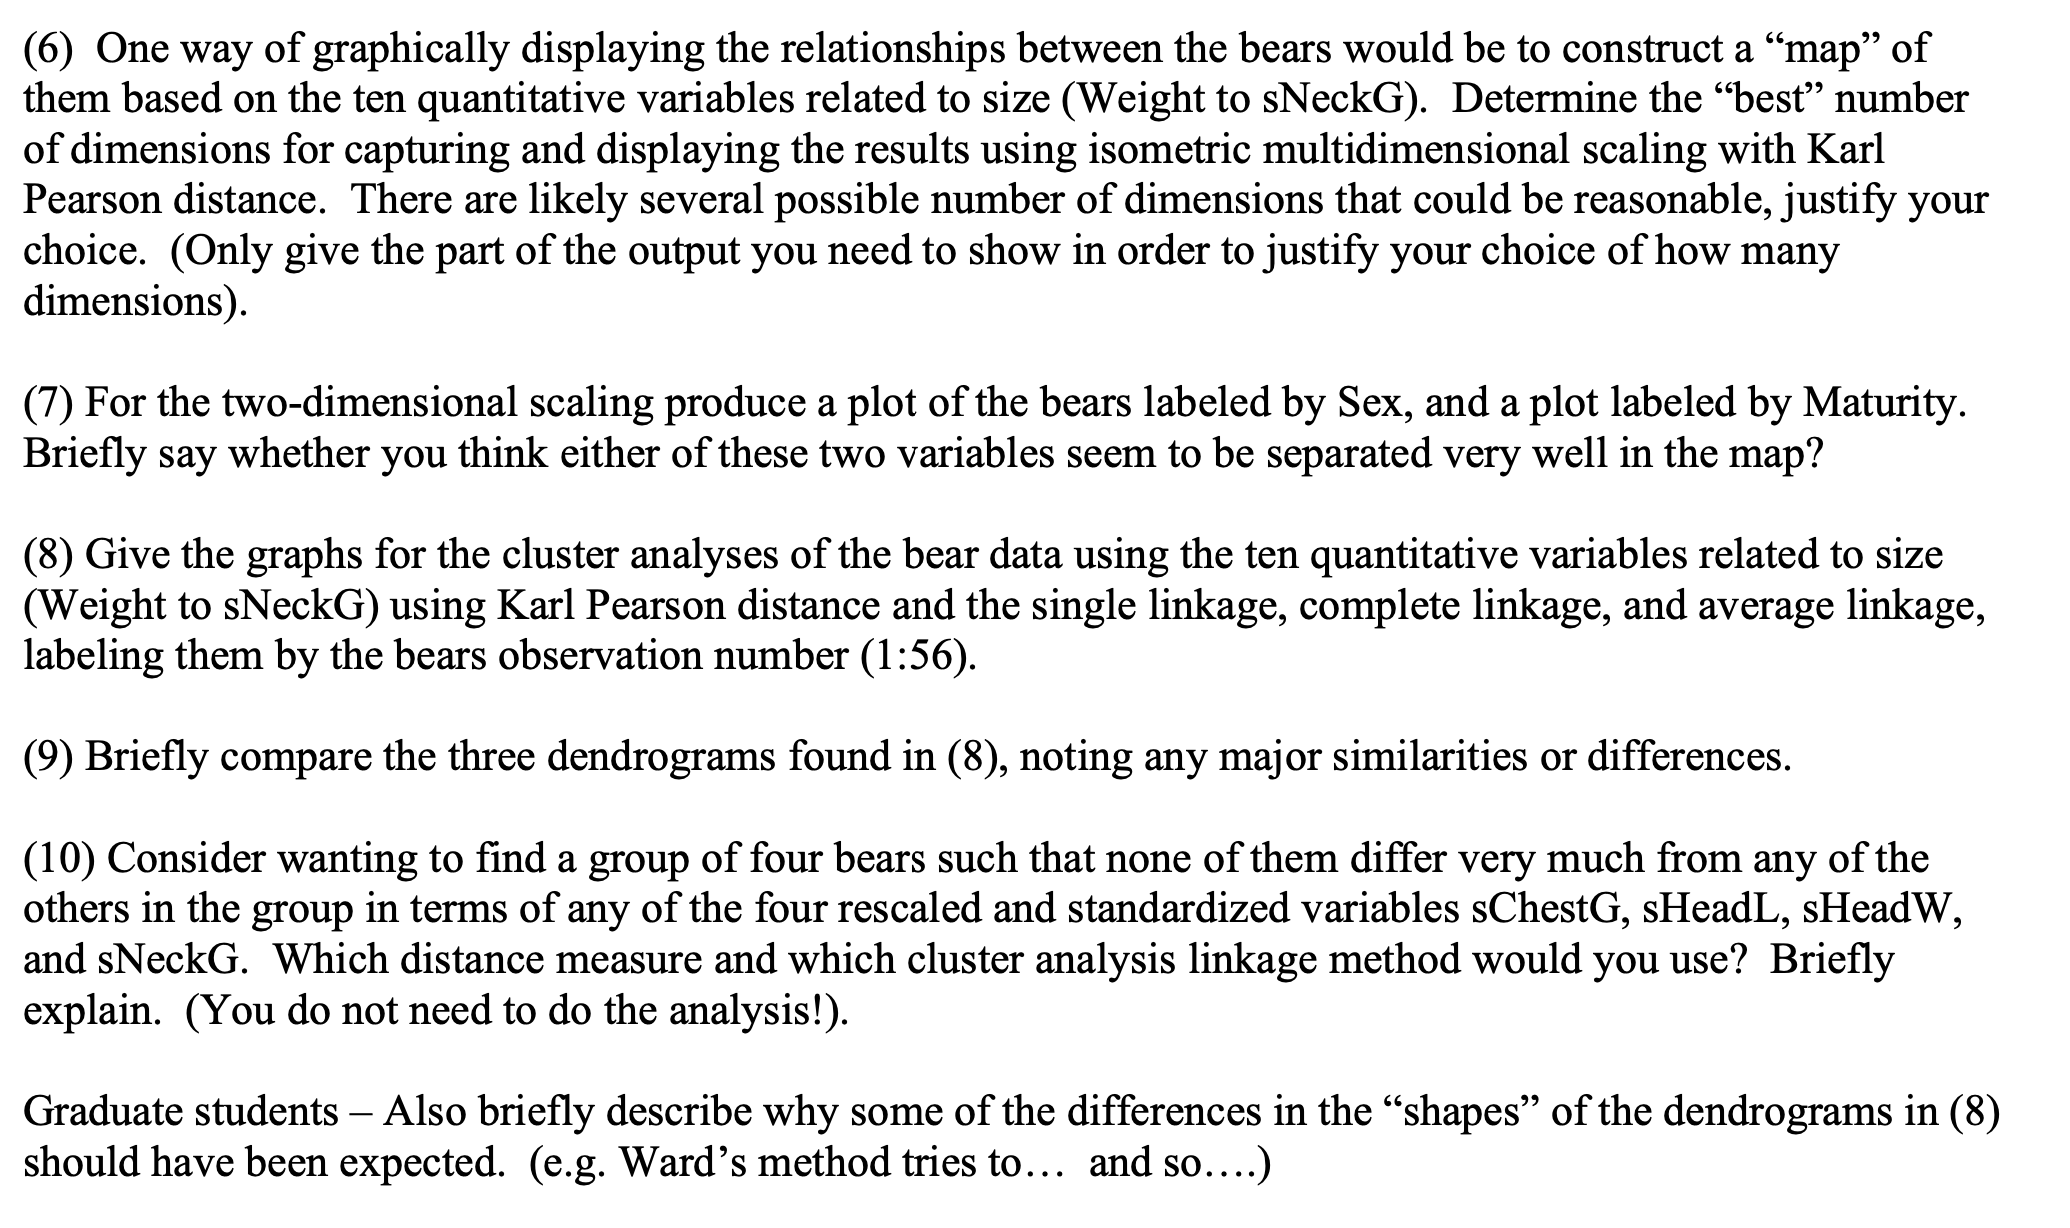
(6) One way of graphically displaying the relationships between the bears would be to construct a map of them based on the ten quantitative variables

image text in transcribed
(6) One way of graphically displaying the relationships between the bears would be to construct a \"map\" of them based on the ten quantitative variables related to size (Weight to sNeckG). Determine the 'best\" number of dimensions for capturing and displaying the results using isometric multidimensional scaling with Karl Pearson distance. There are likely several possible number of dimensions that could be reasonable, justify your choice. (Only give the part of the output you need to show in order to justify your choice of how many dimensions). (7) For the two-dimensional scaling produce a plot of the bears labeled by Sex, and a plot labeled by Maturity. Briey say whether you think either of these two variables seem to be separated very well in the map? (8) Give the graphs for the cluster analyses of the bear data using the ten quantitative variables related to size (Weight to sNeckG) using Karl Pearson distance and the single linkage, complete linkage, and average linkage, labeling them by the bears observation number (1 :56). (9) Briey compare the three dendrograms found in (8), noting any major similarities or differences. (10) Consider wanting to nd a group of four bears such that none of them differ very much from any of the others in the group in terms of any of the four rescaled and standardized variables sChestG, sHeadL, sHeadW, and sNeckG. Which distance measure and which cluster analysis linkage method would you use? Briey explain. (You do not need to do the analysis!) Graduate students Also briey describe why some of the differences in the \"shapes\" of the dendrograms in (8) should have been expected. (e. g. Ward's method tries to... and so. . ..)

Step by Step Solution

There are 3 Steps involved in it

Step: 1

blur-text-image

Get Instant Access to Expert-Tailored Solutions

See step-by-step solutions with expert insights and AI powered tools for academic success

Step: 2

blur-text-image

Step: 3

blur-text-image

Ace Your Homework with AI

Get the answers you need in no time with our AI-driven, step-by-step assistance

Get Started

Recommended Textbook for

Square Summable Power Series

Authors: Louis De Branges, James Rovnyak

1st Edition

ISBN: 0486801365, 9780486801360

More Books

Students also viewed these Mathematics questions

Question

2. Describe how technology can impact intercultural interaction.

Answered: 1 week ago