

Answered step by step
Verified Expert Solution
Question
1 Approved Answer
6 Problem 17-1A Calculating and analyzing trend percents LO P1 Selected comparative financial statements of Haroun Company follow. ($ thousands) Sales Cost of goods sold
6 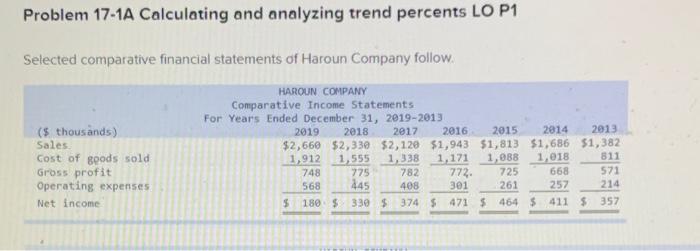
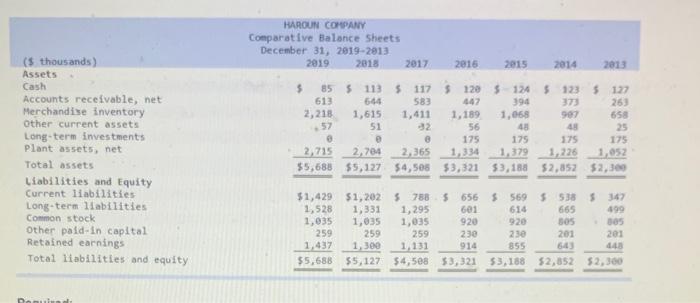
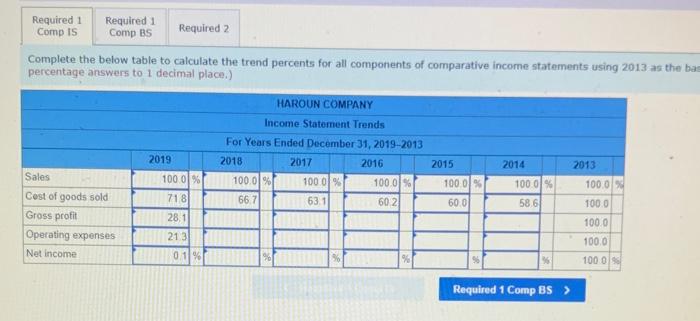
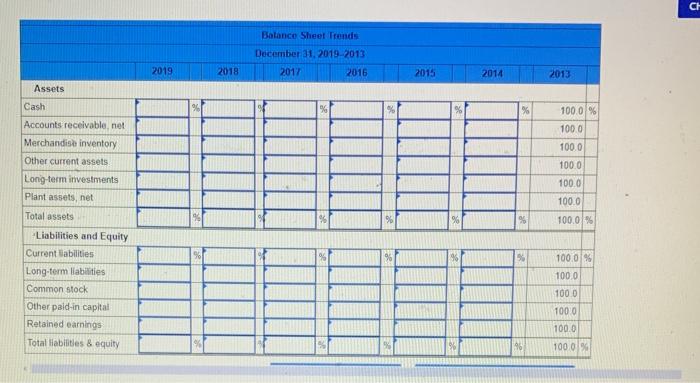
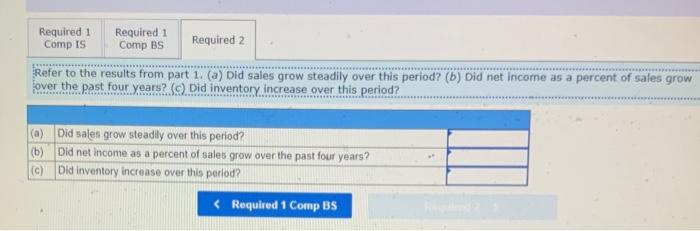
Problem 17-1A Calculating and analyzing trend percents LO P1 Selected comparative financial statements of Haroun Company follow. ($ thousands) Sales Cost of goods sold Gross profit Operating expenses Net income HAROUN COMPANY Comparative Income Statements For Years Ended December 31, 2019-2013 2019 2018 2017 2016 2015 2014 2013 $2,660 $2,330 $2,120 $1,943 $1,813 $1,686 $1,382 1,912 1,555 1,338 1,171 1,088 1,018 811 748 775 782 772 725 668 571 568 408 301 261 257 214 $180 $ 330 $ 374 5 471 $ 464 $ 411 $ 357 245 2017 ($ thousands) Assets Cash Accounts receivable, net Merchandise inventory Other current assets Long-term investments Plant assets, net Total assets Liabilities and Equity Current liabilities Long-term liabilities Common stock Other paid in capital Retained earnings Total liabilities and equity HAROUN COMPANY Comparative Balance Sheets December 31, 2019-2013 2019 2013 2016 2015 2014 2013 $ 855 113 117 1205 124 5 1235 127 613 544 583 447 394 373 260 2,218 1,615 1,411 1,189 1.068 907 650 57 51 32 56 48 48 25 175 175 175 175 2,715 2,704 2.365 1,334 1,379 1,226 1,052 55,688 $5,127 54,585 $3,321 53,188 $2.852 $2,300 $1,429 $1,202 $ 788 $ 656 1,528 1,331 1, 295 601 1,035 1,035 1,035 920 259 259 259 230 1,437 1,300 1.131 $5,688 $5,127 $4,508 53,321 $ 569 5538 5347 614 665 499 920 SOS 305 23 201 201 855 448 53,188 $2,852 $2,300 914 Damund Required 1 Required 1 Comp is Comp BS Required 2 Complete the below table to calculate the trend percents for all components of comparative income statements using 2013 as the bas percentage answers to 1 decimal place.) HAROUN COMPANY Income Statement Trends For Years Ended December 31, 2019-2013 2018 2017 2016 100.0% 100 0% 100.0% 66.7 63.1 60.2 2019 2013 Sales 100 0% 718 2015 100.0 % 2014 1000% 58,6 100.0% 60.0 100.0 28.1 Cost of goods sold Gross profit Operating expenses Net income 100.0 213 1000 0.1% 55 1000 Required 1 Comp BS > CH Balance Sheet Trends December 31, 2019-2013 2017 2016 2019 2018 2015 2014 2013 Assets % % 100.0 % 100.0 100.0 100.0 100.0 100.0 Cash Accounts receivable net Merchandise inventory Other current assets Long-term investments Plant assets, net Total assets Liabilities and Equity Current abilities Long-term liabilities Common stock Other pald-in capital Retained earnings Total liabilities & equity % 100.0% 100.0 % 1000 100.0 1000 100.0 100 019 Required 1 Comp IS Required 1 Comp BS Required 2 Refer to the results from part 1. (a) Did sales grow steadily over this period? (b) Did net income as a percent of sales grow over the past four years? (9) Did inventory increase over this period? (a) Did sales grow steadily over this period? (b) Did net income as a percent of sales grow over the past four years? (c) Did inventory increase over this period? Step by Step Solution
There are 3 Steps involved in it
Step: 1

Get Instant Access to Expert-Tailored Solutions
See step-by-step solutions with expert insights and AI powered tools for academic success
Step: 2

Step: 3
Ace Your Homework with AI
Get the answers you need in no time with our AI-driven, step-by-step assistance
Get Started
Financial Accounting
Authors: J. David Spiceland ,Wayne M. Thomas ,Don Herrmann
2nd Revised Edition
0071088385, 978-0071088381