
6 STAT Homework Questions
1.
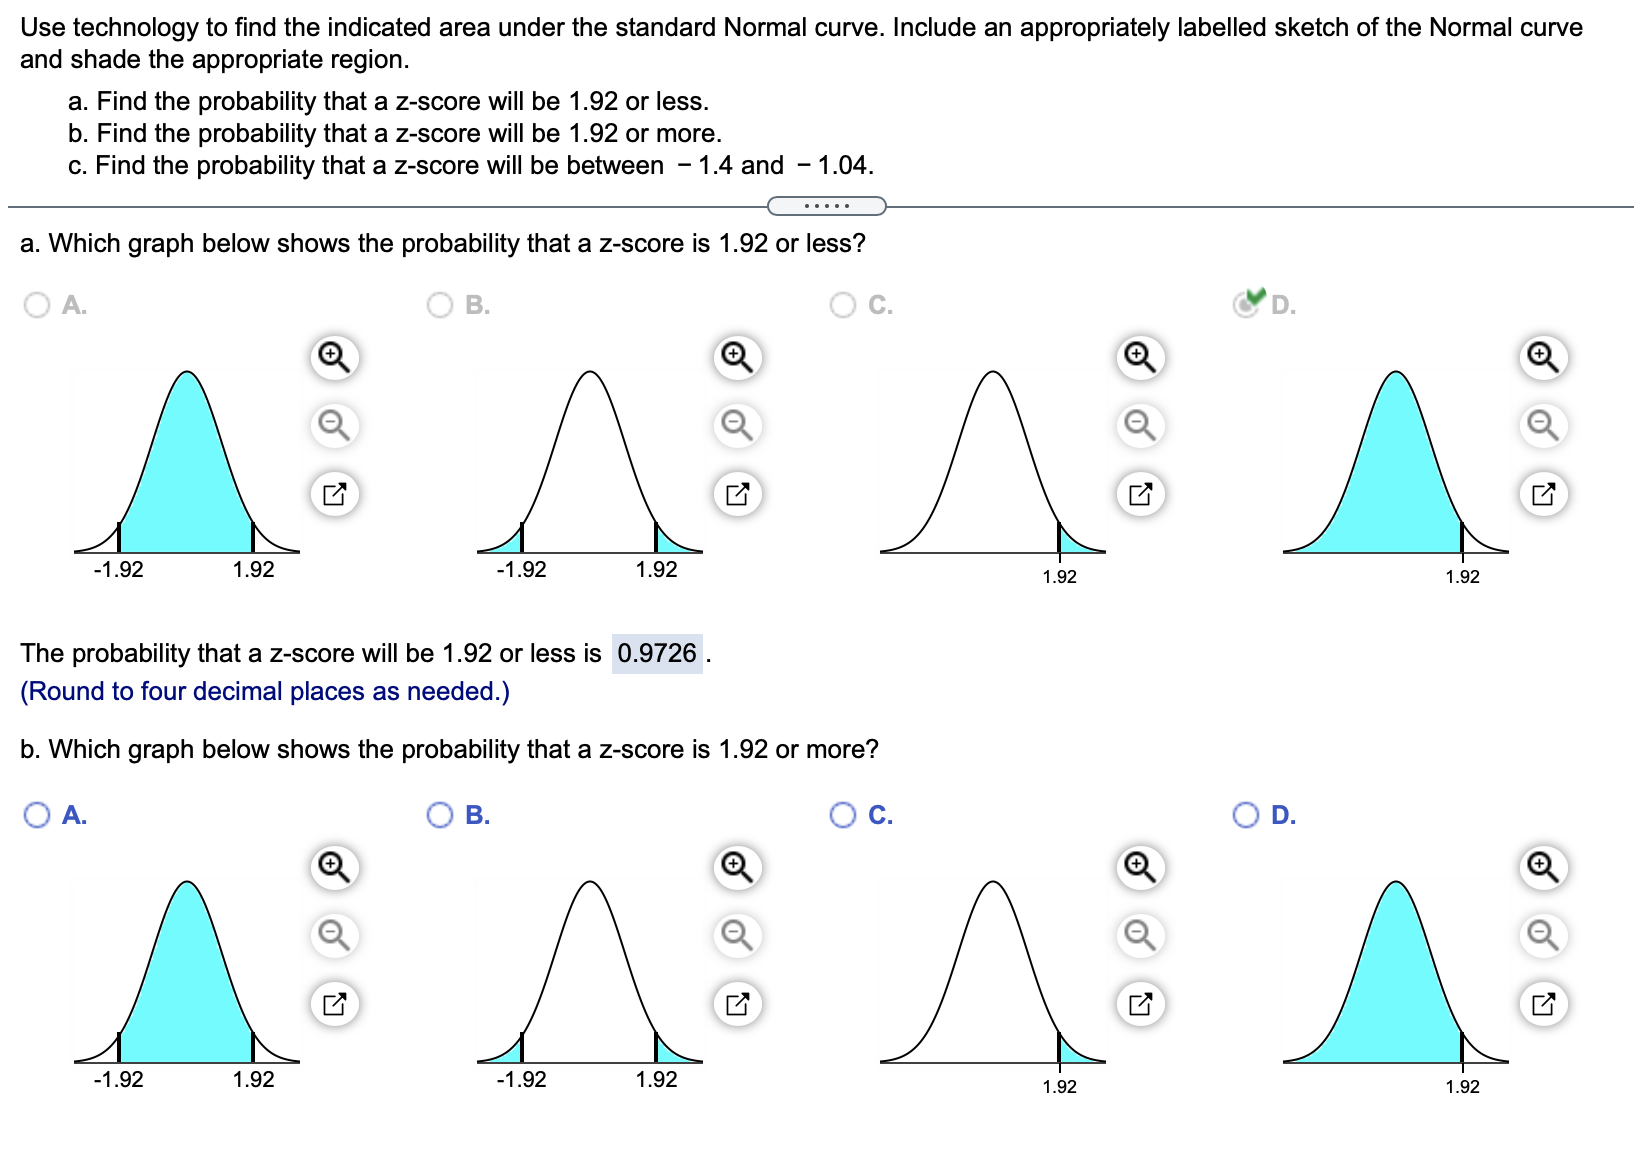
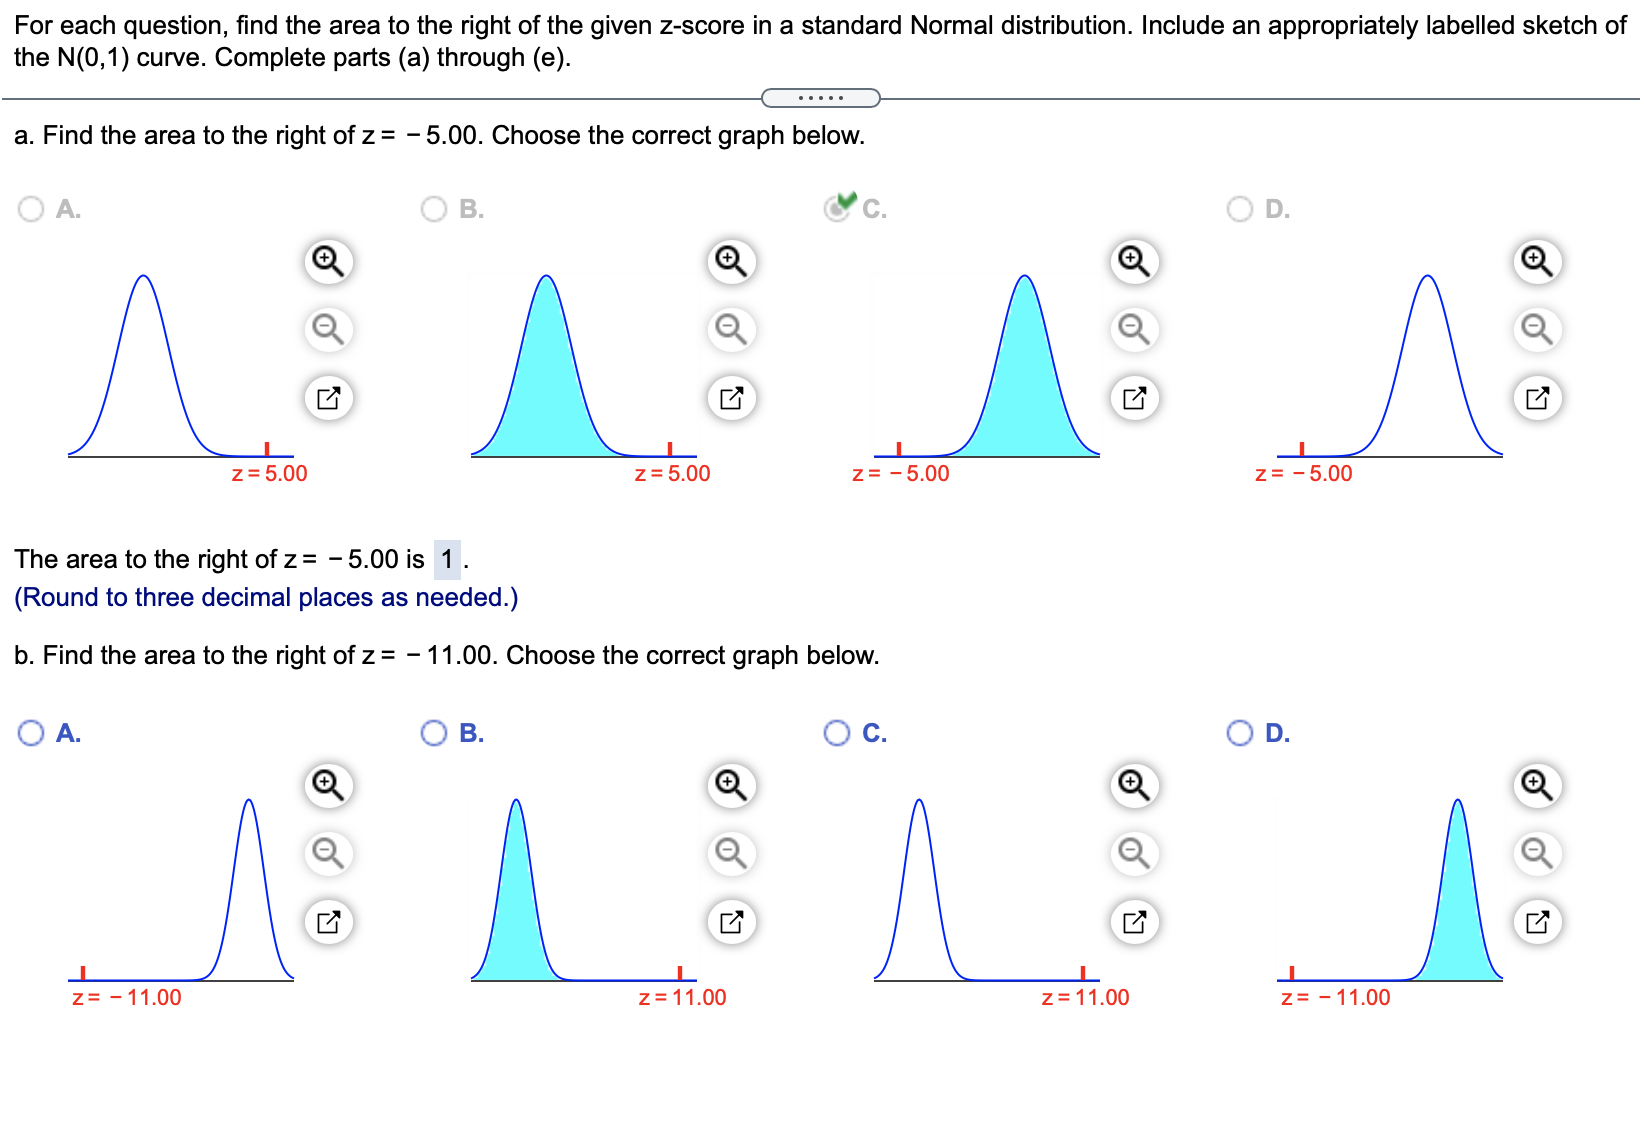
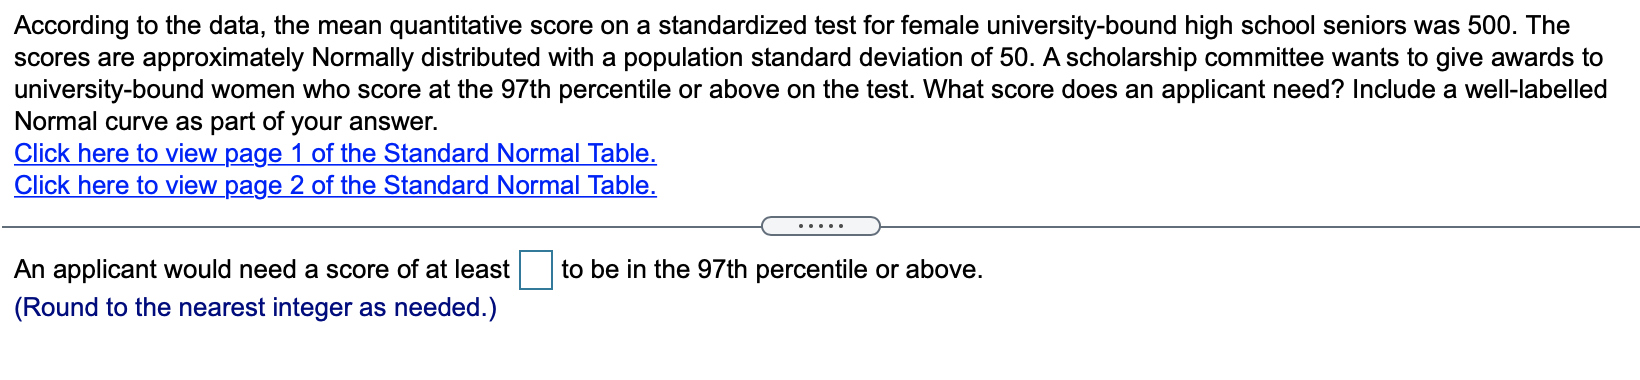
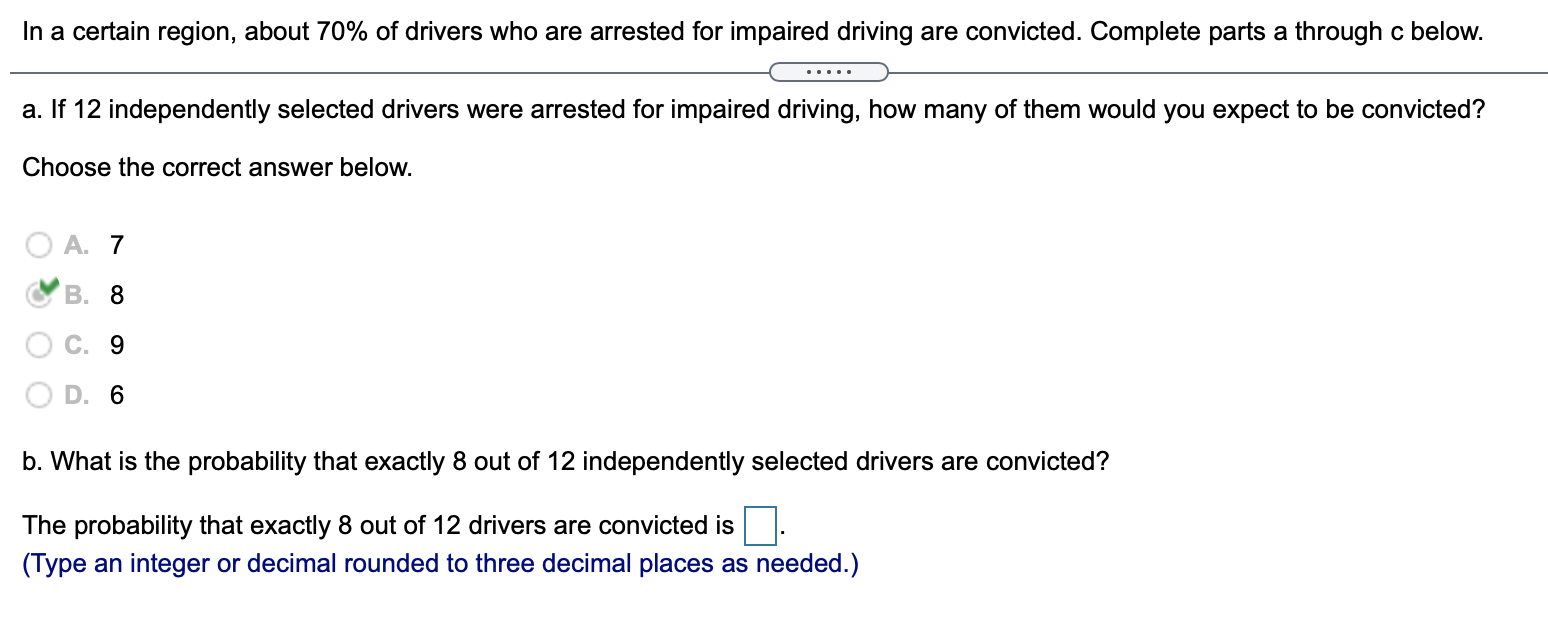
Wechsler IQs have a population mean of 100 and a population standard deviation of 15 and are approximately Normally distributed. Use one of the technology outputs below to find the probability that a randomly selected person will have an IQ of 105 or above. State whether Figure (a) or Figure (b) is the correct representation of a person with an IQ of 105 or above. . . . . . Figure (a) Figure (b) Density Density 0.025 0.025 0.02 0.02 0.015 0.015 0.01 0.01 0.005 0.005 60 80 100 120 140 60 80 100 120 140 X Meanc 100 Sid. Dev.: 15 Mearc 100 Std. Dev- 15 Prob( X c= 105 0.36944134 Prob( X -> 105 0.63055866 Use Figure (a) to find the probability. The probability that a randomly selected person will have an IQ of 105 or above is (Round to four decimal places as needed.)Use technology to find the indicated area under the standard Normal curve. Include an appropriately labelled sketch of the Normal curve and shade the appropriate region. a. Find the probability that a z-score will be 1.92 or less. b. Find the probability that a z-score will be 1.92 or more. c. Find the probability that a z-score will be between - 1.4 and - 1.04. \" a. Which graph below shows the probability that a z-score is 1.92 or less? A a c 3a Q a a Q a a IZ? I3 I3 IZ' -1.92 1.92 -132 1.92 132 99 The probability that a zscore will be 1.92 or less is 0.9726 . (Round to four decimal places as needed.) b. Which graph below shows the probability that a z-score is 1.92 or more? 0A 03 00 on a Q a a ll" I3" I3 I3 -1.92 1.92 -1.92 1.92 132 99 99 For each question, nd the area to the right of the given z-score in a standard Normal distribution. Include an appropriately labelled sketch of the N(0,1) curve. Complete parts (a) through (e). m a. Find the area to the right of z = - 5.00. Choose the correct graph below. A a 3c o a a a 0. a a E E E E z=5.00 z=5.00 z= -5.00 z= -5.00 9,9 The area to the right of 2: - 5.00 is 1 . (Round to three decimal places as needed.) b. Find the area to the right of z = 11.00. Choose the correct graph below. 0A Go on On a a a a a Q E E E E z=-11.00 z=11.00 z=11.00 z=-11.00 ,op According to the data, the mean quantitative score on a standardized test for female university-bound high school seniors was 500. The scores are approximately Normally distributed with a population standard deviation of 50. Ascholarship committee wants to give awards to university-bound women who score at the 97th percentile or above on the test. What score does an applicant need? Include a well-labelled Normal curve as part of your answer. Click here to view [age 1 of the Standard Normal Table. Click here to view page 2 of the Standard Normal Table. An applicant would need a score of at least D to be in the 97th percentile or above. (Round to the nearest integer as needed.) In a certain region, about 70% of drivers who are arrested for impaired driving are convicted. Complete parts a through c below. a. If 12 independently selected drivers were arrested for impaired driving, how many of them would you expect to be convicted? Choose the correct answer below. C. 7 N B. 8 9 D. 6 b. What is the probability that exactly 8 out of 12 independently selected drivers are convicted? The probability that exactly 8 out of 12 drivers are convicted is El. (Type an integer or decimal rounded to three decimal places as needed.) According to a study in 2010, 15% of women in a certain country have ended their childbearing years without having children (In the 19703, this number was 10%). Complete parts a through c below. a. If we randomly select 100 women, how many would we expect to have had no children? Give or take how many? The expected number of women who had no children is D, give or take El. (Round to the nearest integers as needed.)


