

Answered step by step
Verified Expert Solution
Question
1 Approved Answer
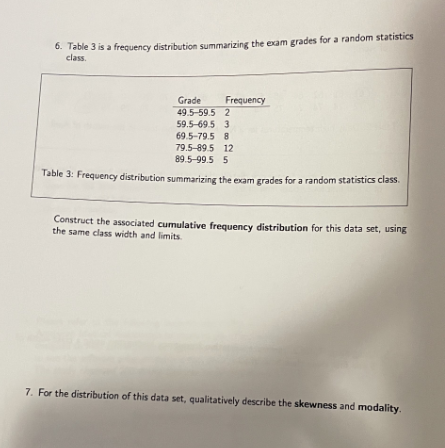
6. Table 3 is a frequency distribution summarizing the exam grades for a random statistics class. Grade Frequency 49 5-59.5 2 59.5-69 5 3 69
Step by Step Solution
There are 3 Steps involved in it
Step: 1

Get Instant Access to Expert-Tailored Solutions
See step-by-step solutions with expert insights and AI powered tools for academic success
Step: 2

Step: 3
Ace Your Homework with AI
Get the answers you need in no time with our AI-driven, step-by-step assistance
Get Started