Answered step by step
Verified Expert Solution
Question
1 Approved Answer
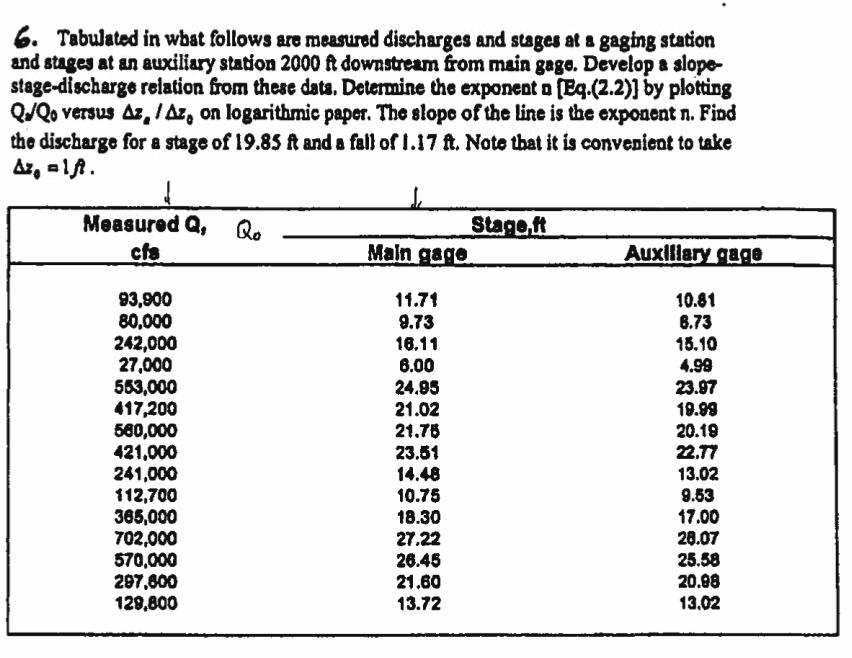
6. Tabulated in what follows are measured discharges and stages at a gaging station and stages at an auxiliary station 2000 ft downstream from

6. Tabulated in what follows are measured discharges and stages at a gaging station and stages at an auxiliary station 2000 ft downstream from main gage. Develop a slope- stage-discharge relation from these data. Determine the exponent a [Eq.(2.2)] by plotting QQo versus Az/Az, on logarithmic paper. The slope of the line is the exponent n. Find the discharge for a stage of 19.85 ft and a fall of 1.17 ft. Note that it is convenient to take Measured Q, Qo cfs 93,900 Stage.ft Main gage Auxiliary gage 11.71 10.81 80,000 9.73 6.73 242,000 16.11 15.10 27,000 6.00 4.99 553,000 24.95 23.97 417,200 21.02 19.99 560,000 21.75 20.19 421,000 23.51 22.77 241,000 14.48 13.02 112,700 10.75 9.53 365,000 18.30 17.00 702,000 27.22 28.07 570,000 26.45 25.58 297,600 21.60 20.98 129,800 13.72 13.02
Step by Step Solution
There are 3 Steps involved in it
Step: 1

Get Instant Access to Expert-Tailored Solutions
See step-by-step solutions with expert insights and AI powered tools for academic success
Step: 2

Step: 3

Ace Your Homework with AI
Get the answers you need in no time with our AI-driven, step-by-step assistance
Get Started


