| 6th Edition | 2014 | 2015 | Benchmark | Favorable (F), Unfavorable (U), or Approximate (A)? 2015/2014 |
- Current ratio
| | | 2.00 | |
- Days cash on hand
| | | 15.00 | |
- Days in A/R
| | | 45.00 | |
- Operating margin
| | | 4% | |
- Return on total assets
| | | 4% | |
- Return on net assets
| | | 10% | |
- Debt to capitalization
| | | 50% | |
- Times interest earned
| | | 4.00 | |
- Debt service coverage
| | | 2.00 | |
- Fixed asset turnover
| | | 3.00 | |
- Salary and benefit/NPSR
| | | 55% | |
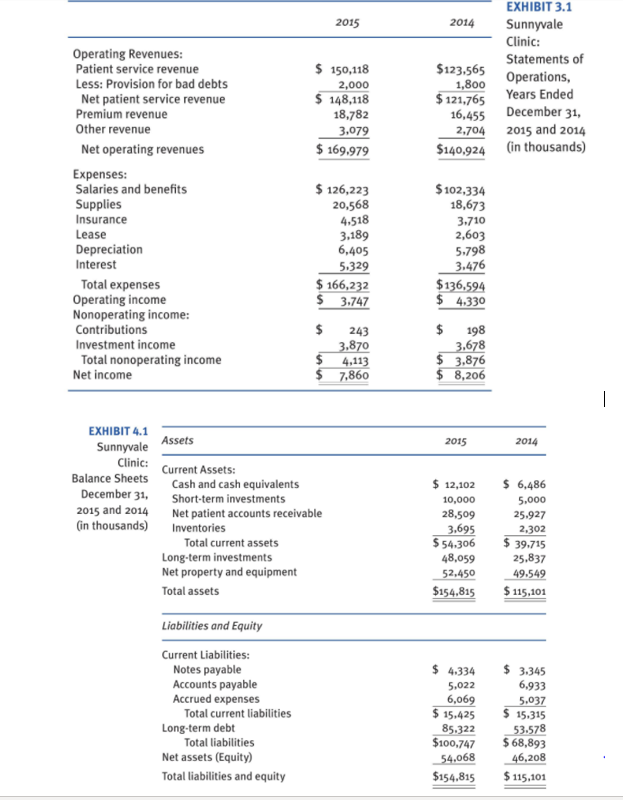
4. Common Activity/Productivity Ratios . Fixed asset turnover = Total Revenues in Statement of Operations / Net Property and Equipment o Salary and benefits as a % of net patient revenue = Salaries and Benefits in Statement of Operations / Net Patient Service Revenue in Statement of Operations 2015 $ 150,118 2,000 $ 148,118 18,782 3.079 $ 169,979 EXHIBIT 3.1 2014 Sunnyvale Clinic: $123,565 Statements of Operations, 1,800 $ 121,765 Years Ended 16,455 December 31, 2,704 2015 and 2014 $140,924 (in thousands) Operating Revenues: Patient service revenue Less: Provision for bad debts Net patient service revenue Premium revenue Other revenue Net operating revenues Expenses: Salaries and benefits Supplies Insurance Lease Depreciation Interest Total expenses Operating income Nonoperating income: Contributions Investment income Total nonoperating income Net income $ 126,223 20,568 4.518 3,189 6,405 5.329 $ 166,232 $ 3.747 $ 3,870 $ 4,113 $ 7,860 $102,334 18,673 3.710 2,603 5,798 3.476 $136,594 $ 4.330 243 $ 198 3.678 $ 3,876 $ 8,206 | Assets 2015 2014 EXHIBIT 4.1 Sunnyvale Clinic: Balance Sheets December 31, 2015 and 2014 in thousands) Current Assets: Cash and cash equivalents Short-term investments Net patient accounts receivable Inventories Total current assets Long-term investments Net property and equipment Total assets $ 12,102 10,000 28,509 3.695 $ 54.306 48,059 52.450 $154.815 $ 6,486 5,000 25.927 2.302 $ 39,715 25.837 49.549 $ 115,101 Liabilities and Equity Current Liabilities: Notes payable Accounts payable Accrued expenses Total current liabilities Long-term debt Total liabilities Net assets (Equity) Total liabilities and equity $ 4.334 5,022 6,069 $ 15.425 85.322 $100,747 54,068 $154.815 $ 3.345 6,933 5,037 $ 15.315 53.578 $ 68,893 46,208 $ 115,101 4. Common Activity/Productivity Ratios . Fixed asset turnover = Total Revenues in Statement of Operations / Net Property and Equipment o Salary and benefits as a % of net patient revenue = Salaries and Benefits in Statement of Operations / Net Patient Service Revenue in Statement of Operations 2015 $ 150,118 2,000 $ 148,118 18,782 3.079 $ 169,979 EXHIBIT 3.1 2014 Sunnyvale Clinic: $123,565 Statements of Operations, 1,800 $ 121,765 Years Ended 16,455 December 31, 2,704 2015 and 2014 $140,924 (in thousands) Operating Revenues: Patient service revenue Less: Provision for bad debts Net patient service revenue Premium revenue Other revenue Net operating revenues Expenses: Salaries and benefits Supplies Insurance Lease Depreciation Interest Total expenses Operating income Nonoperating income: Contributions Investment income Total nonoperating income Net income $ 126,223 20,568 4.518 3,189 6,405 5.329 $ 166,232 $ 3.747 $ 3,870 $ 4,113 $ 7,860 $102,334 18,673 3.710 2,603 5,798 3.476 $136,594 $ 4.330 243 $ 198 3.678 $ 3,876 $ 8,206 | Assets 2015 2014 EXHIBIT 4.1 Sunnyvale Clinic: Balance Sheets December 31, 2015 and 2014 in thousands) Current Assets: Cash and cash equivalents Short-term investments Net patient accounts receivable Inventories Total current assets Long-term investments Net property and equipment Total assets $ 12,102 10,000 28,509 3.695 $ 54.306 48,059 52.450 $154.815 $ 6,486 5,000 25.927 2.302 $ 39,715 25.837 49.549 $ 115,101 Liabilities and Equity Current Liabilities: Notes payable Accounts payable Accrued expenses Total current liabilities Long-term debt Total liabilities Net assets (Equity) Total liabilities and equity $ 4.334 5,022 6,069 $ 15.425 85.322 $100,747 54,068 $154.815 $ 3.345 6,933 5,037 $ 15.315 53.578 $ 68,893 46,208 $ 115,101