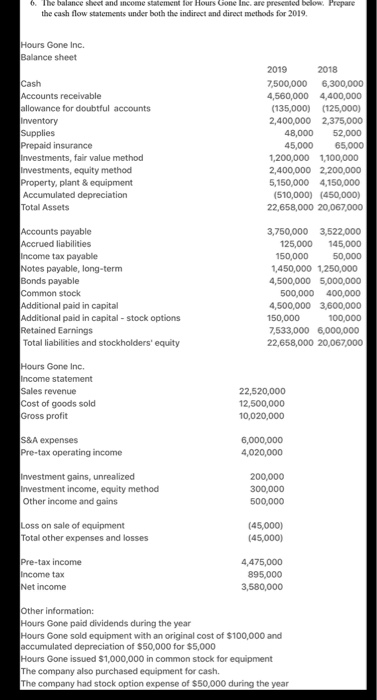
6. The balance sheet and income statement for Hours Gone Inc. are presented below. Prepare the cash flow statements under both the indirect and direct methods for 2019 Hours Gone Inc. Balance sheet Cash Accounts receivable allowance for doubtful accounts Inventory Supplies Prepaid insurance Investments, fair value method investments, equity method Property, plant & equipment Accumulated depreciation Total Assets 2019 2018 7,500,000 6,300,000 4,560,000 4,400,000 (135,000) (125,000) 2,400,000 2,375,000 48,000 52,000 45,000 65,000 1,200,000 1,100,000 2,400,000 2,200,000 5,150,000 4,150,000 (510,000) (450,000) 22,658,000 20,067,000 Accounts payable Accrued liabilities income tax payable Notes payable, long-term Bonds payable Common stock Additional paid in capital Additional paid in capital - stock options Retained Earnings Total liabilities and stockholders' equity 3,750,000 3,522,000 125,000 145,000 150,000 50,000 1,450,000 1,250,000 4,500,000 5,000,000 500,000 400,000 4,500,000 3,600,000 150,000 100,000 7,533,000 6,000,000 22,658,000 20,067,000 Hours Gone Inc. Income statement Sales revenue Cost of goods sold Gross profit 22,520,000 12,500,000 10,020,000 S&A expenses Pre-tax operating income 6,000,000 4,020,000 Investment gains, unrealized Investment income, equity method Other income and gains 200,000 300,000 500,000 Loss on sale of equipment Total other expenses and losses (45,000) (45,000) Pre-tax income income tax Net income 4,475,000 895,000 3,580,000 Other information: Hours Gone paid dividends during the year Hours Gone sold equipment with an original cost of $100,000 and accumulated depreciation of $50,000 for $5,000 Hours Gone issued $1,000,000 in common stock for equipment The company also purchased equipment for cash. The company had stock option expense of $50,000 during the year