Answered step by step
Verified Expert Solution
Link Copied!

Question

1 Approved Answer

6. The figure below shows the total cost and revenue curves for a firm on the same diagram. Construct these two curves in excel TC
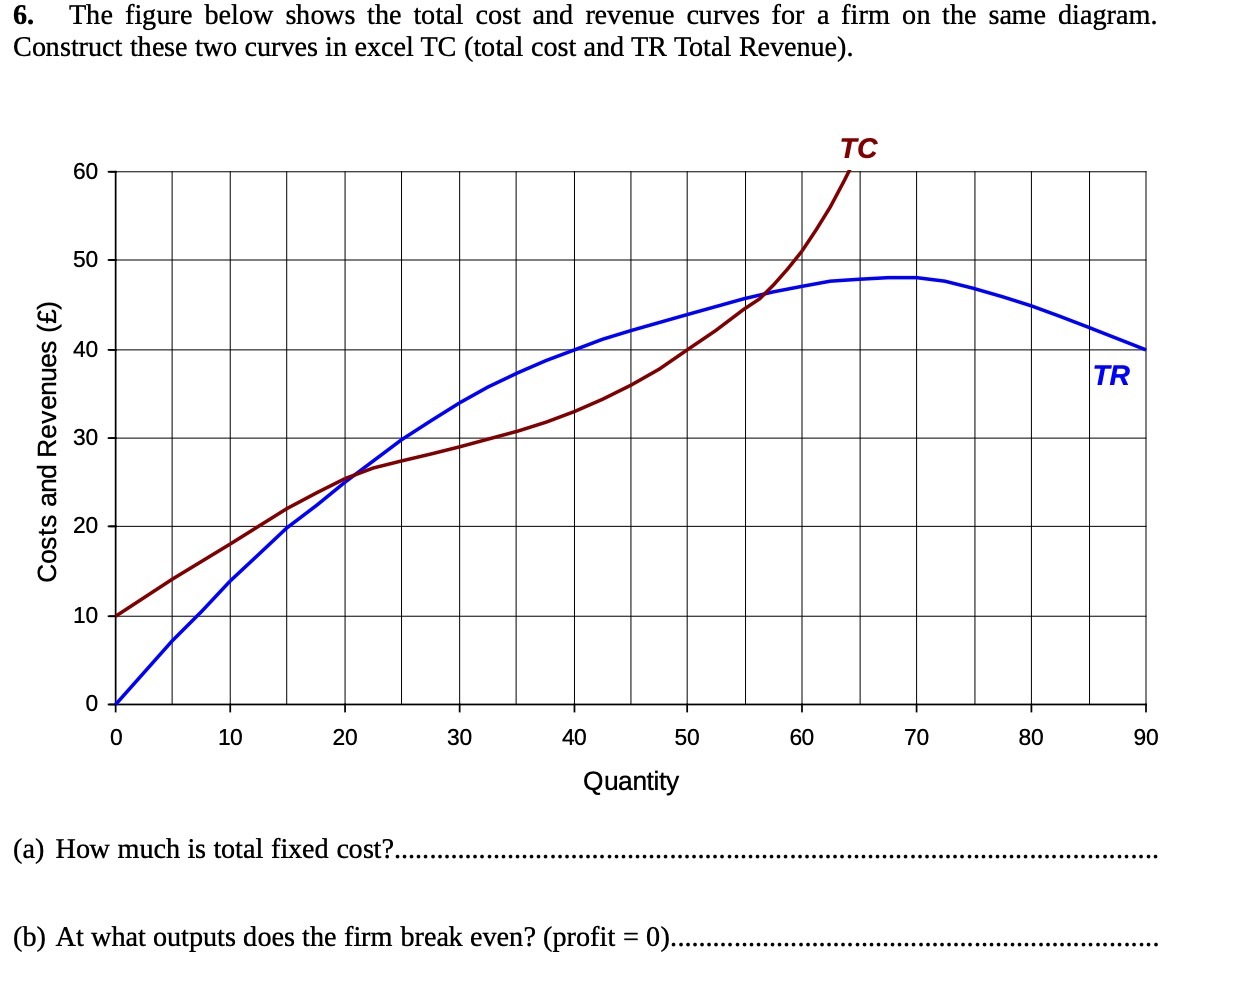
image text in transcribed
6. The figure below shows the total cost and revenue curves for a firm on the same diagram. Construct these two curves in excel TC (total cost and TR Total Revenue). TC so U1 0 Costs and Revenues () to CD II.- %ii II.\" III. II.- E i o 10 20 so 40 so so 70 so 90 Quantity (a) How much is total fixed cost?..... ........ ........ ........ ........ ........ (b) At what outputs does the firm break even? (profit = 0)

Step by Step Solution

There are 3 Steps involved in it

Step: 1

blur-text-image

Get Instant Access to Expert-Tailored Solutions

See step-by-step solutions with expert insights and AI powered tools for academic success

Step: 2

blur-text-image_2

Step: 3

blur-text-image_3

Ace Your Homework with AI

Get the answers you need in no time with our AI-driven, step-by-step assistance

Get Started

Recommended Textbook for

Calculus Early Transcendentals

Authors: James Stewart

7th edition

538497904, 978-0538497909

More Books

Students also viewed these Mathematics questions

Question

What is electric dipole explain with example

Answered: 1 week ago

Question

What is polarization? Describe it with examples.

Answered: 1 week ago