

Answered step by step
Verified Expert Solution
Question
1 Approved Answer
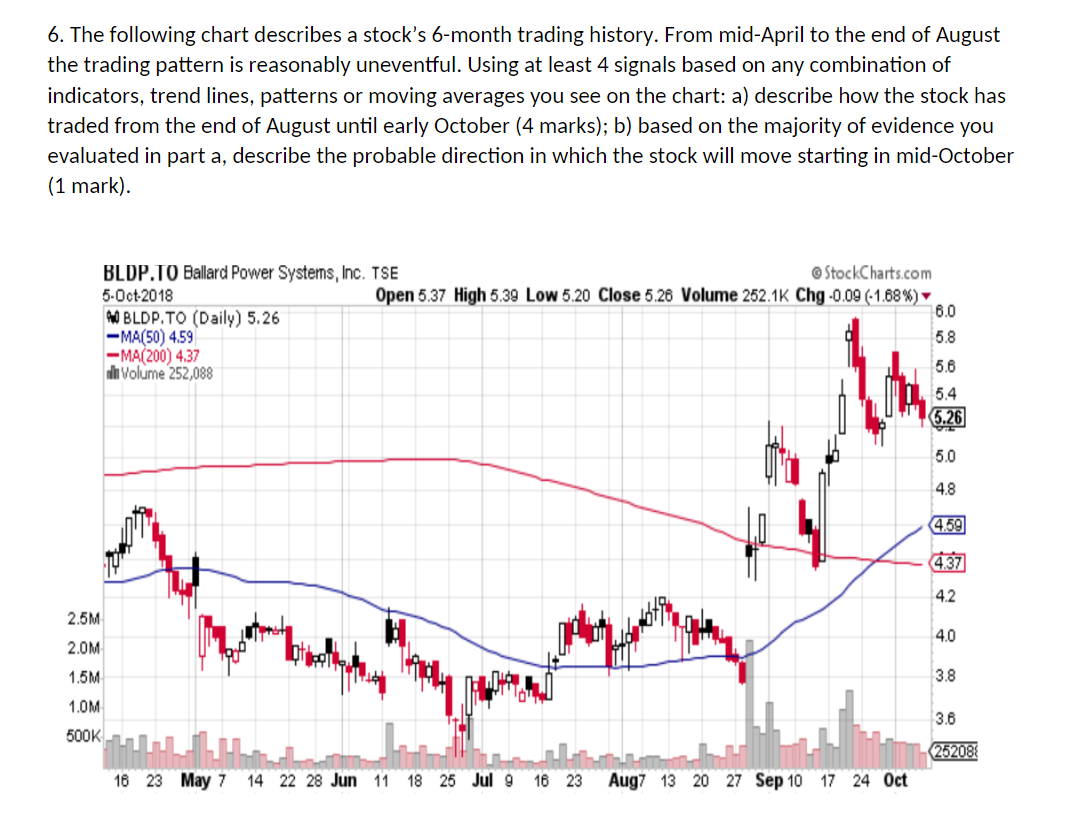
6. The following chart describes a stock's 6-month trading history. From mid-April to the end of August the trading pattern is reasonably uneventful. Using at
Step by Step Solution
There are 3 Steps involved in it
Step: 1

Get Instant Access to Expert-Tailored Solutions
See step-by-step solutions with expert insights and AI powered tools for academic success
Step: 2

Step: 3
Ace Your Homework with AI
Get the answers you need in no time with our AI-driven, step-by-step assistance
Get Started
Personal Finance
Authors: Jack Kapoor, Les Dlabay, Robert J. Hughes
11th edition
9781259278617, 77861647, 1259278611, 978-0077861643