Question: 6. The human intelligence quotient, or IO, is computed according to the following formula: 10 =- tar Mental Age -x 100. m sigo Chronological Age
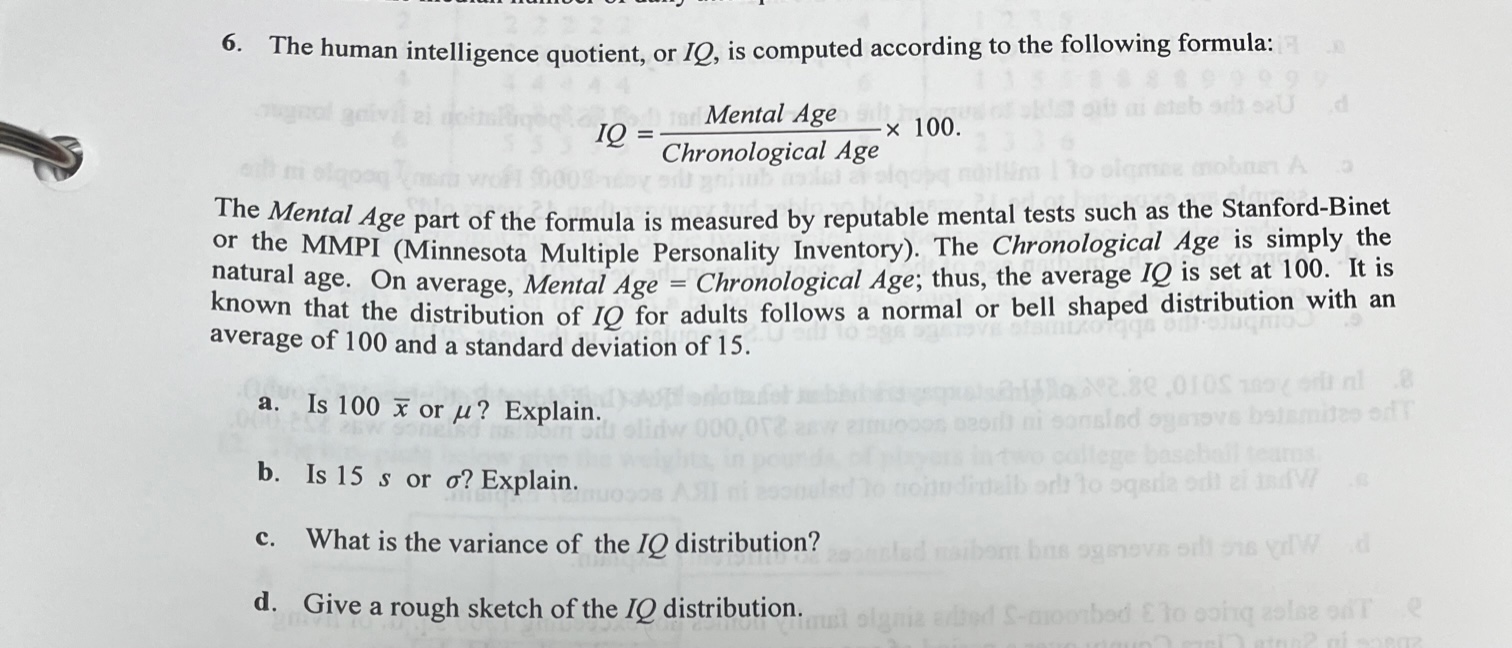
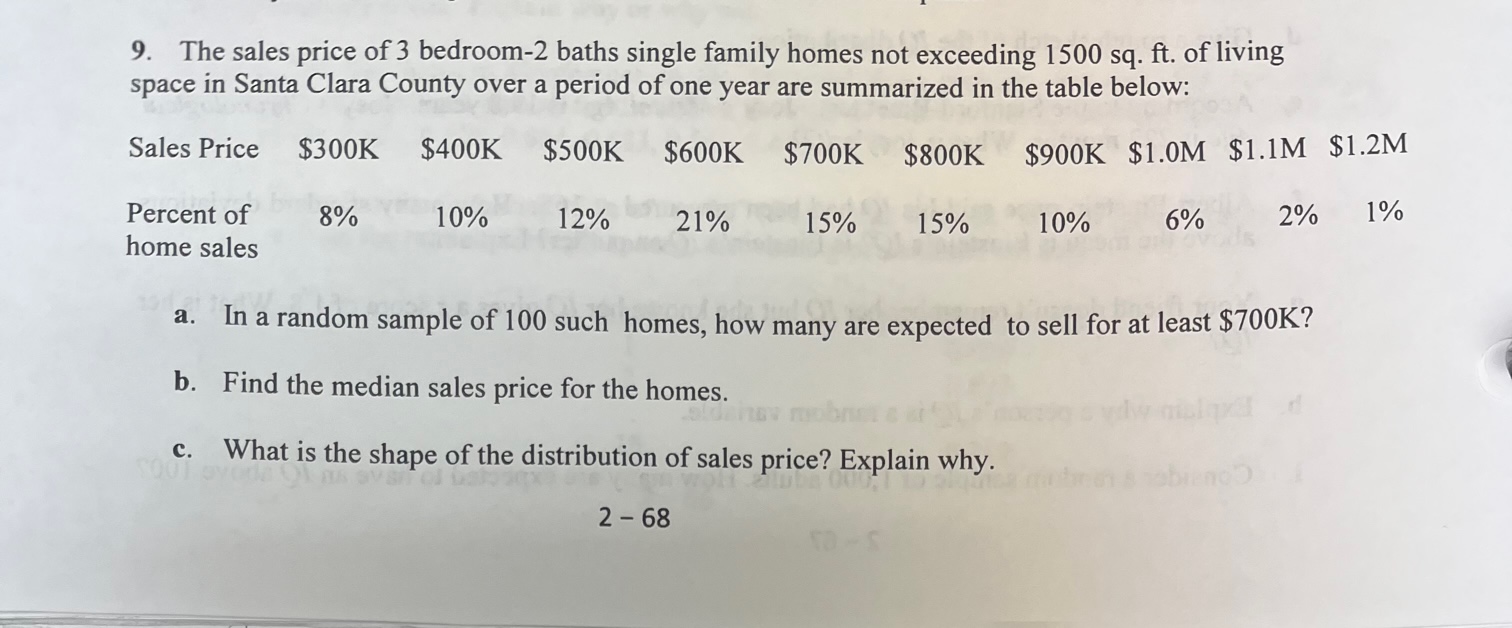
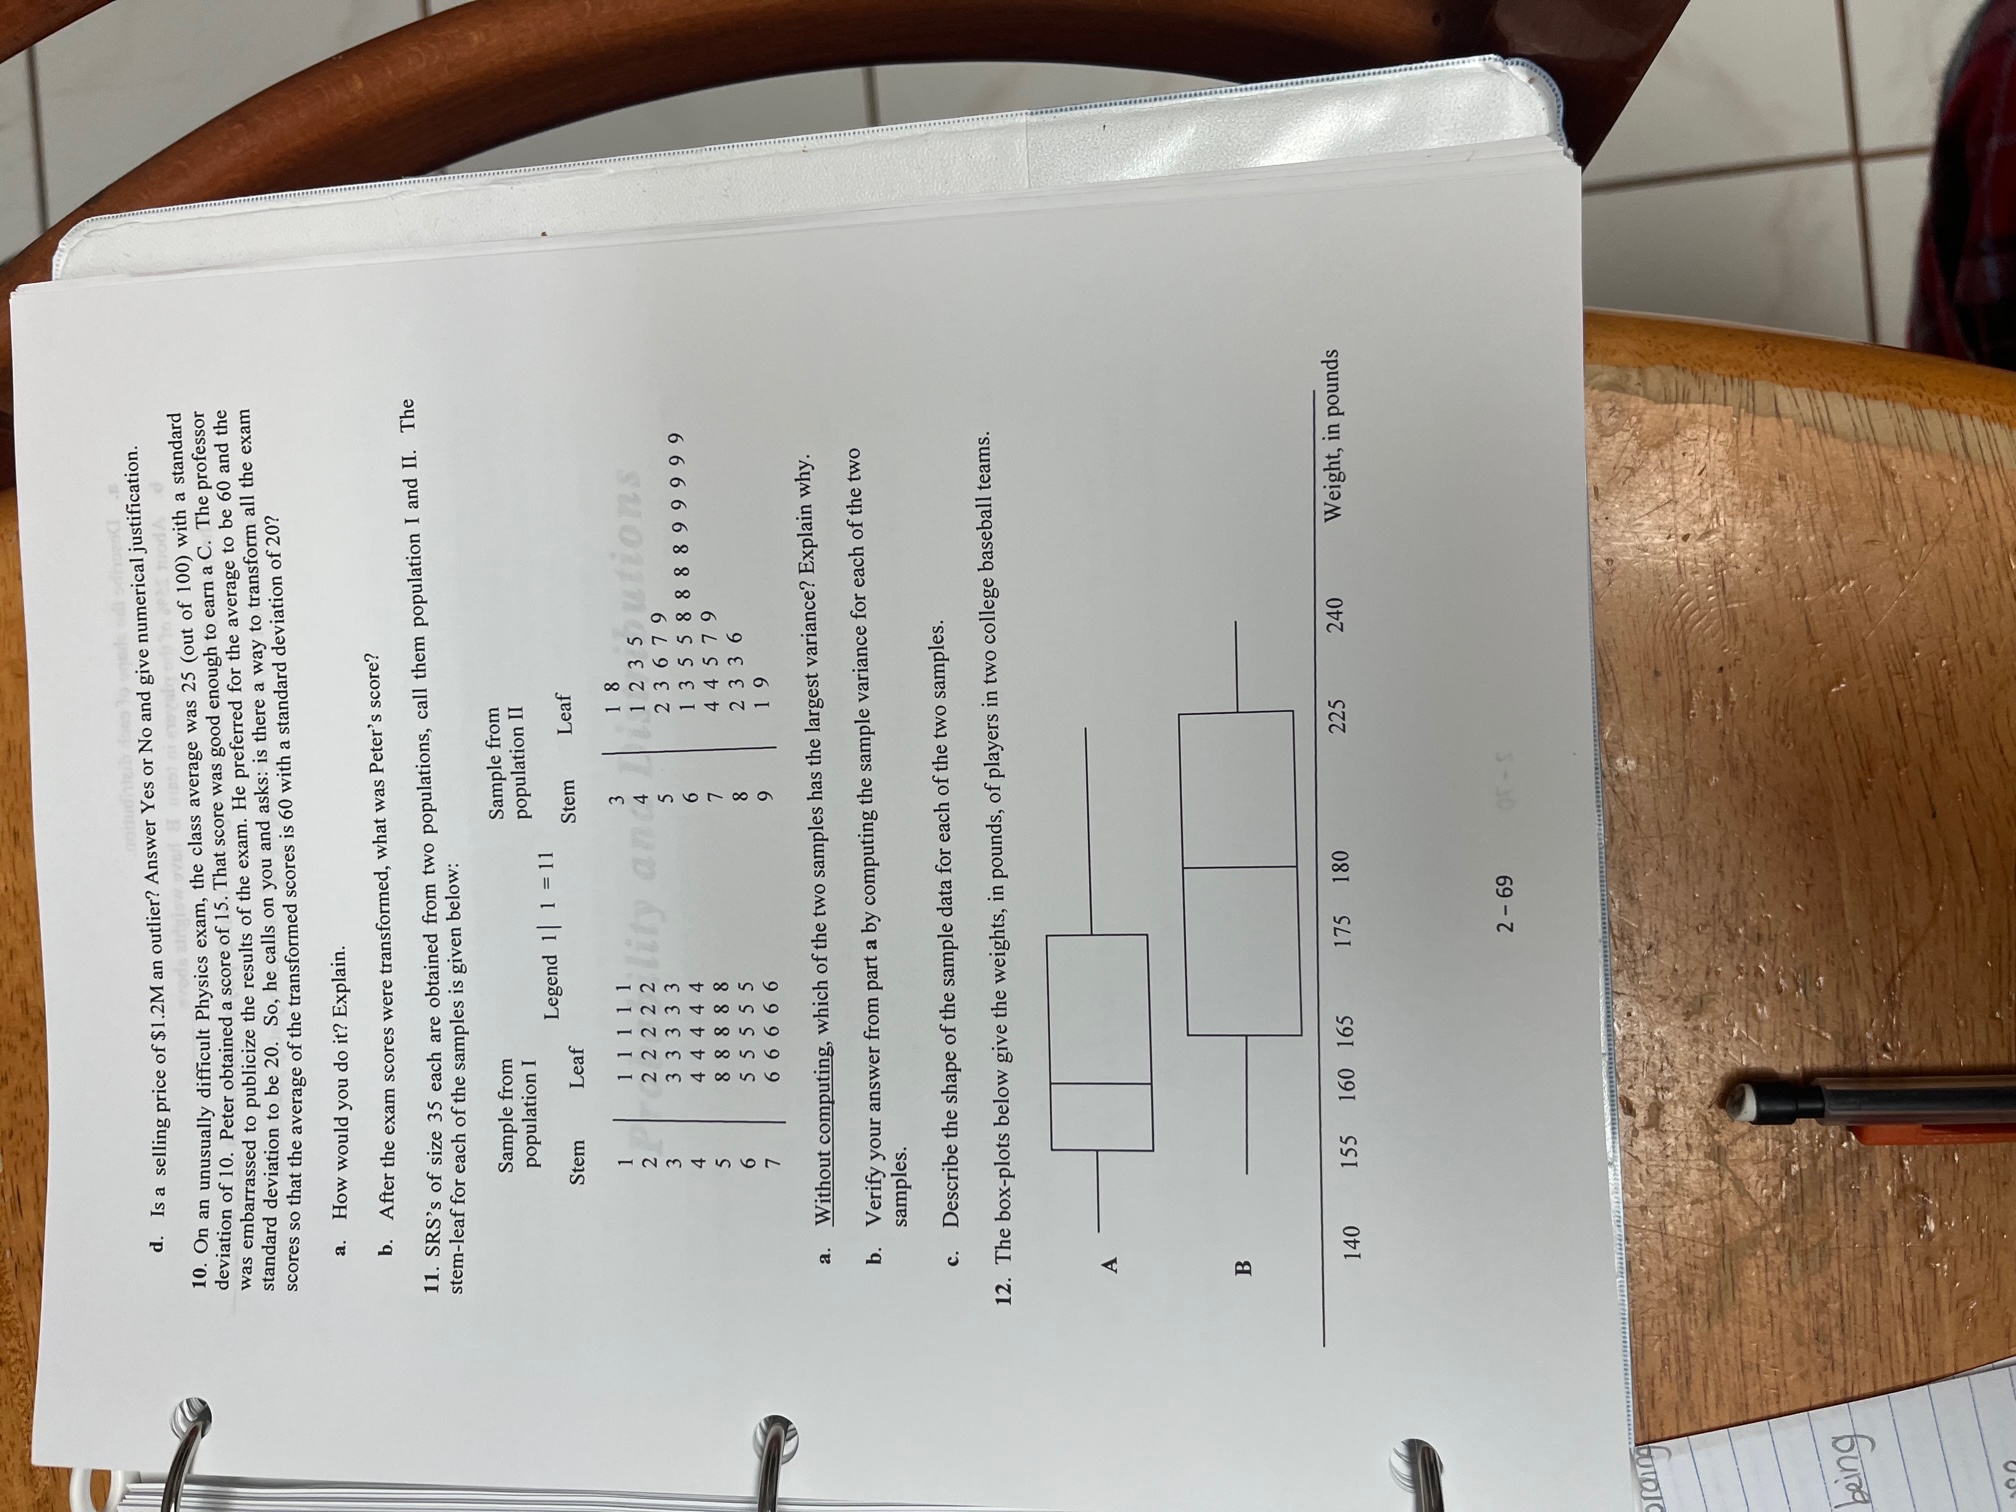
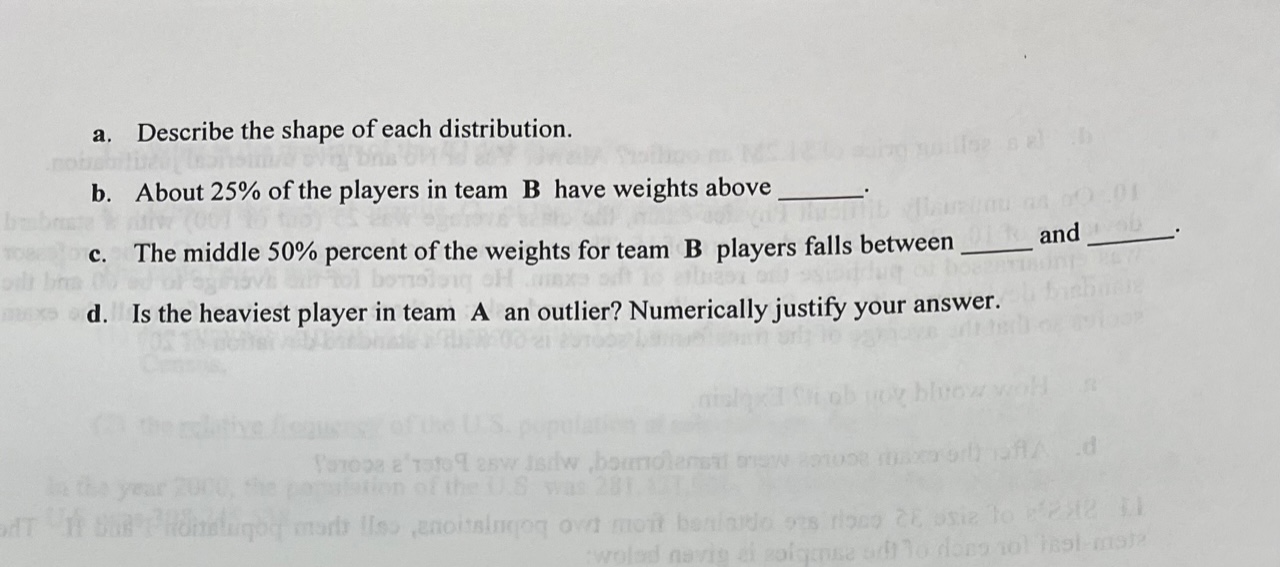
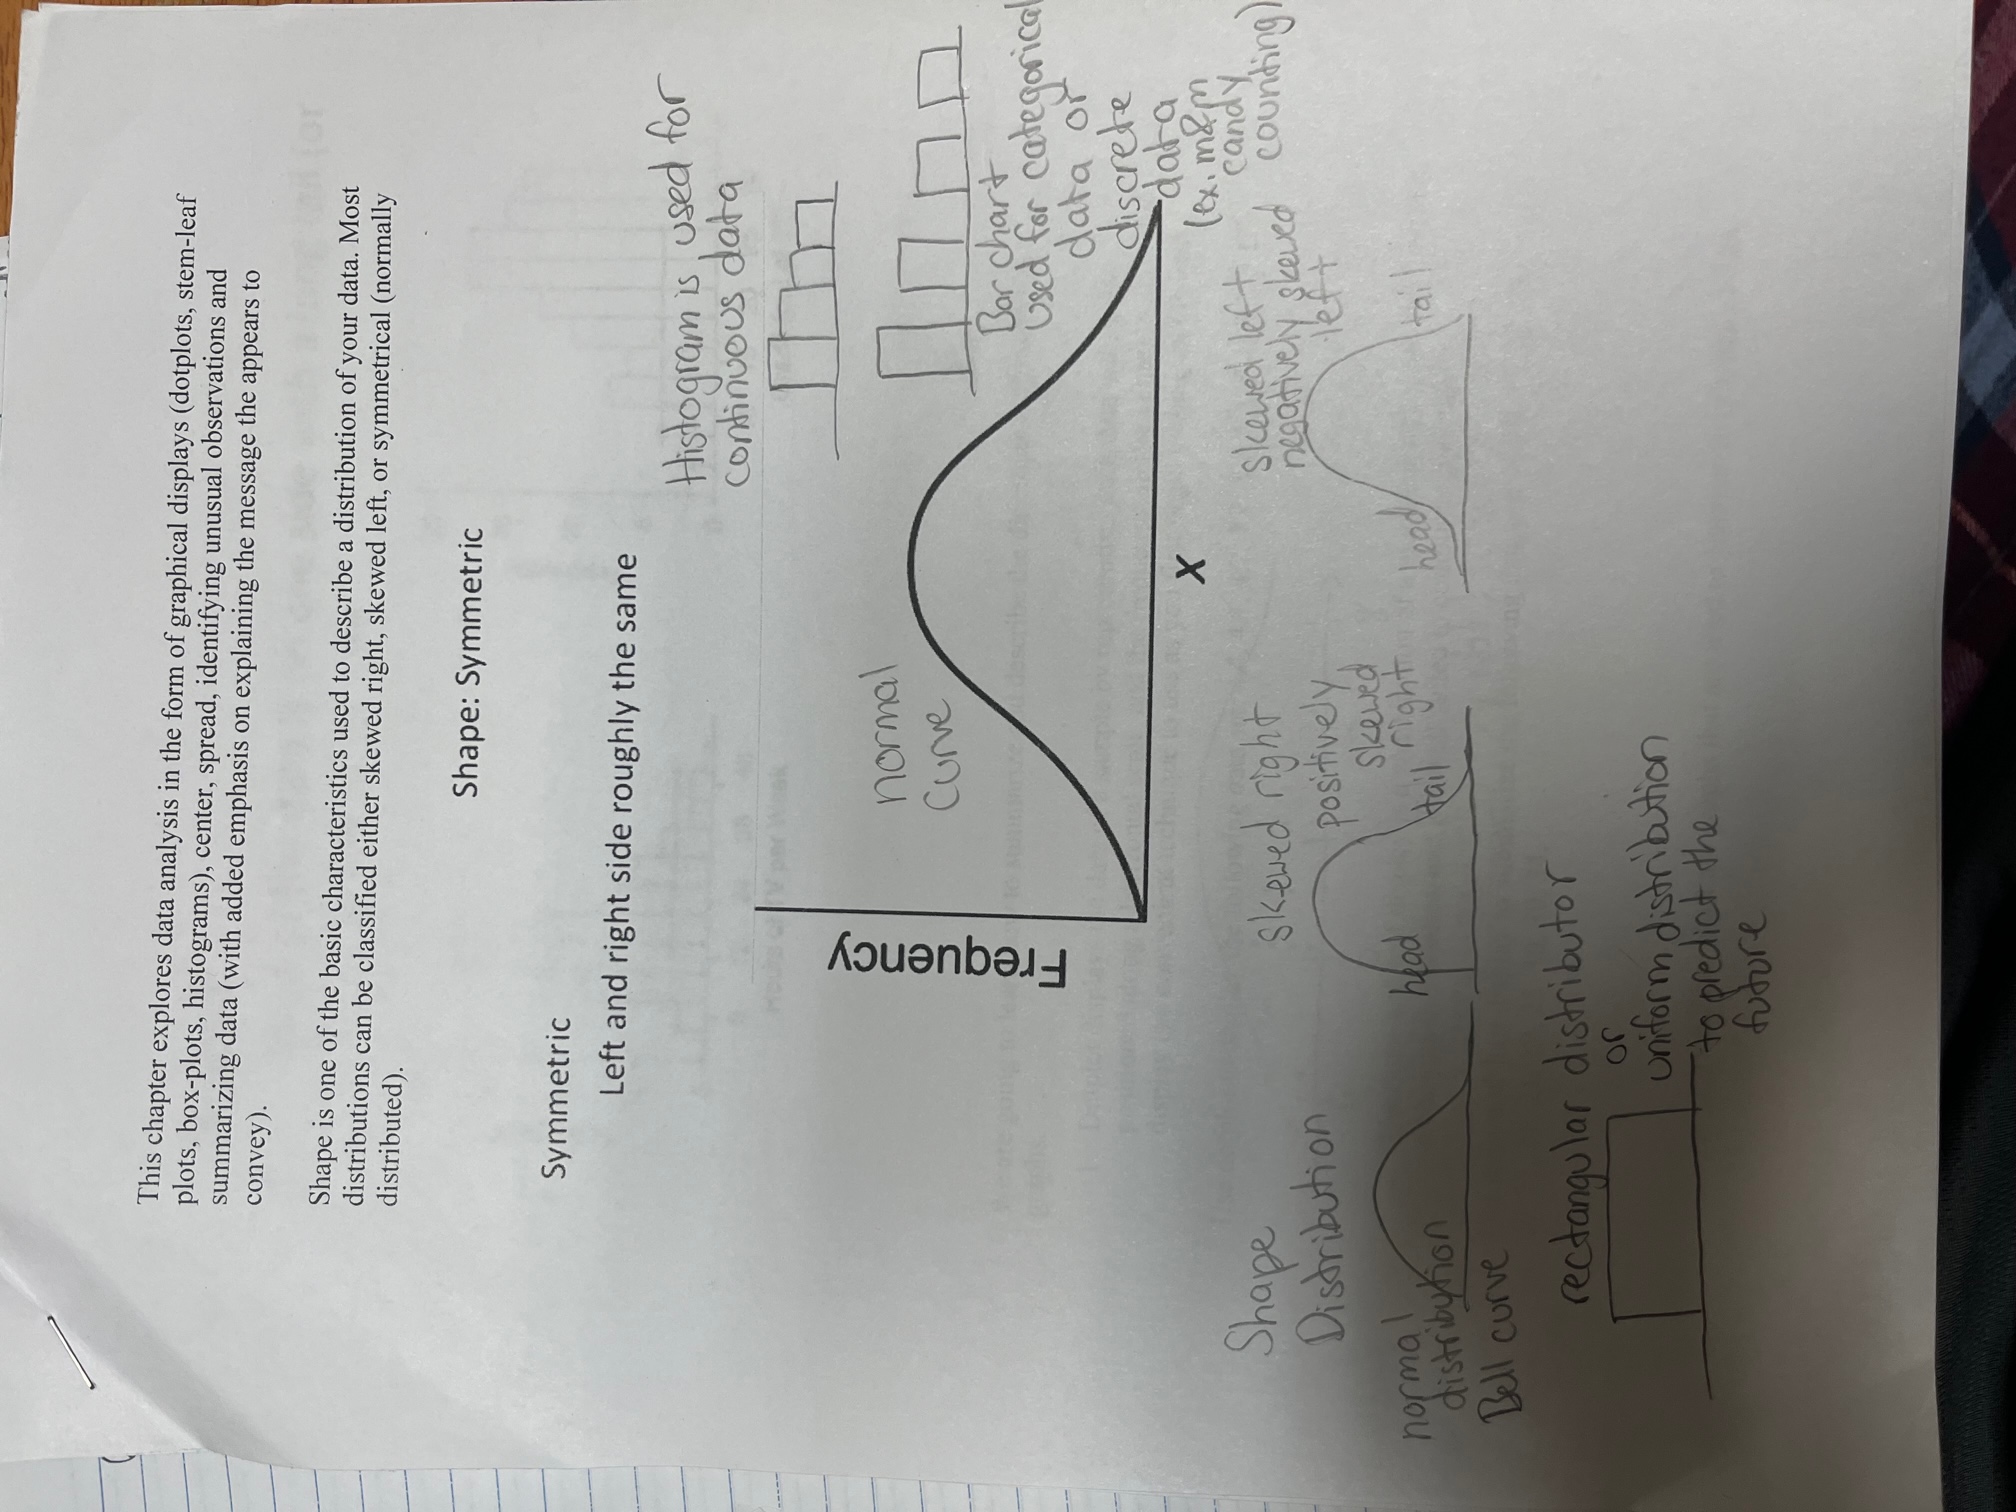
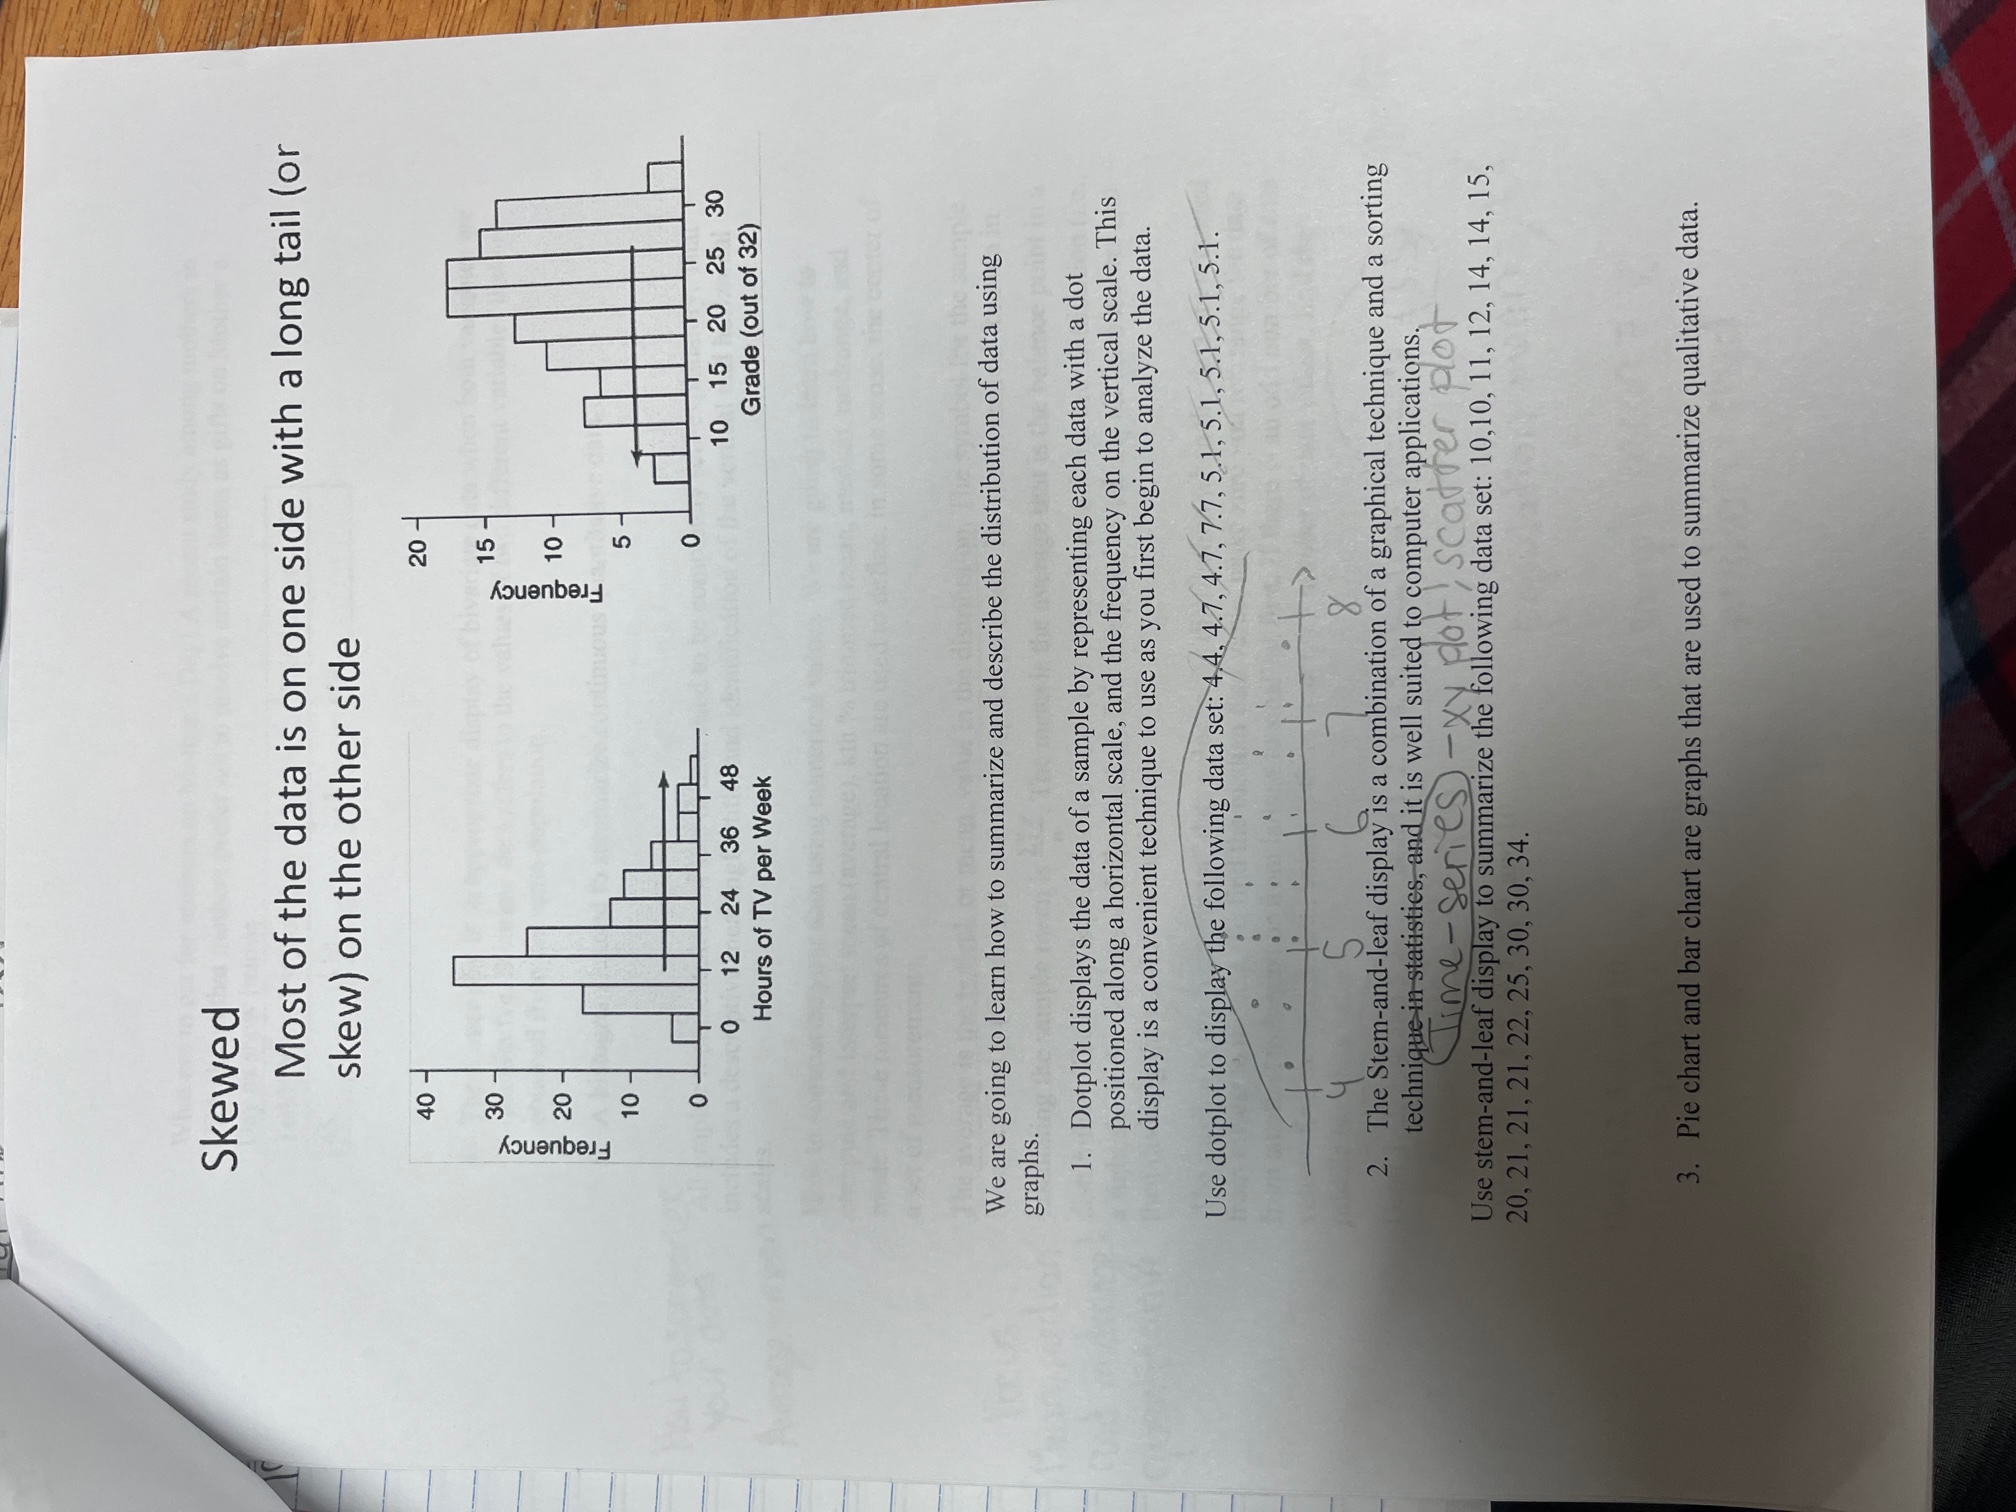
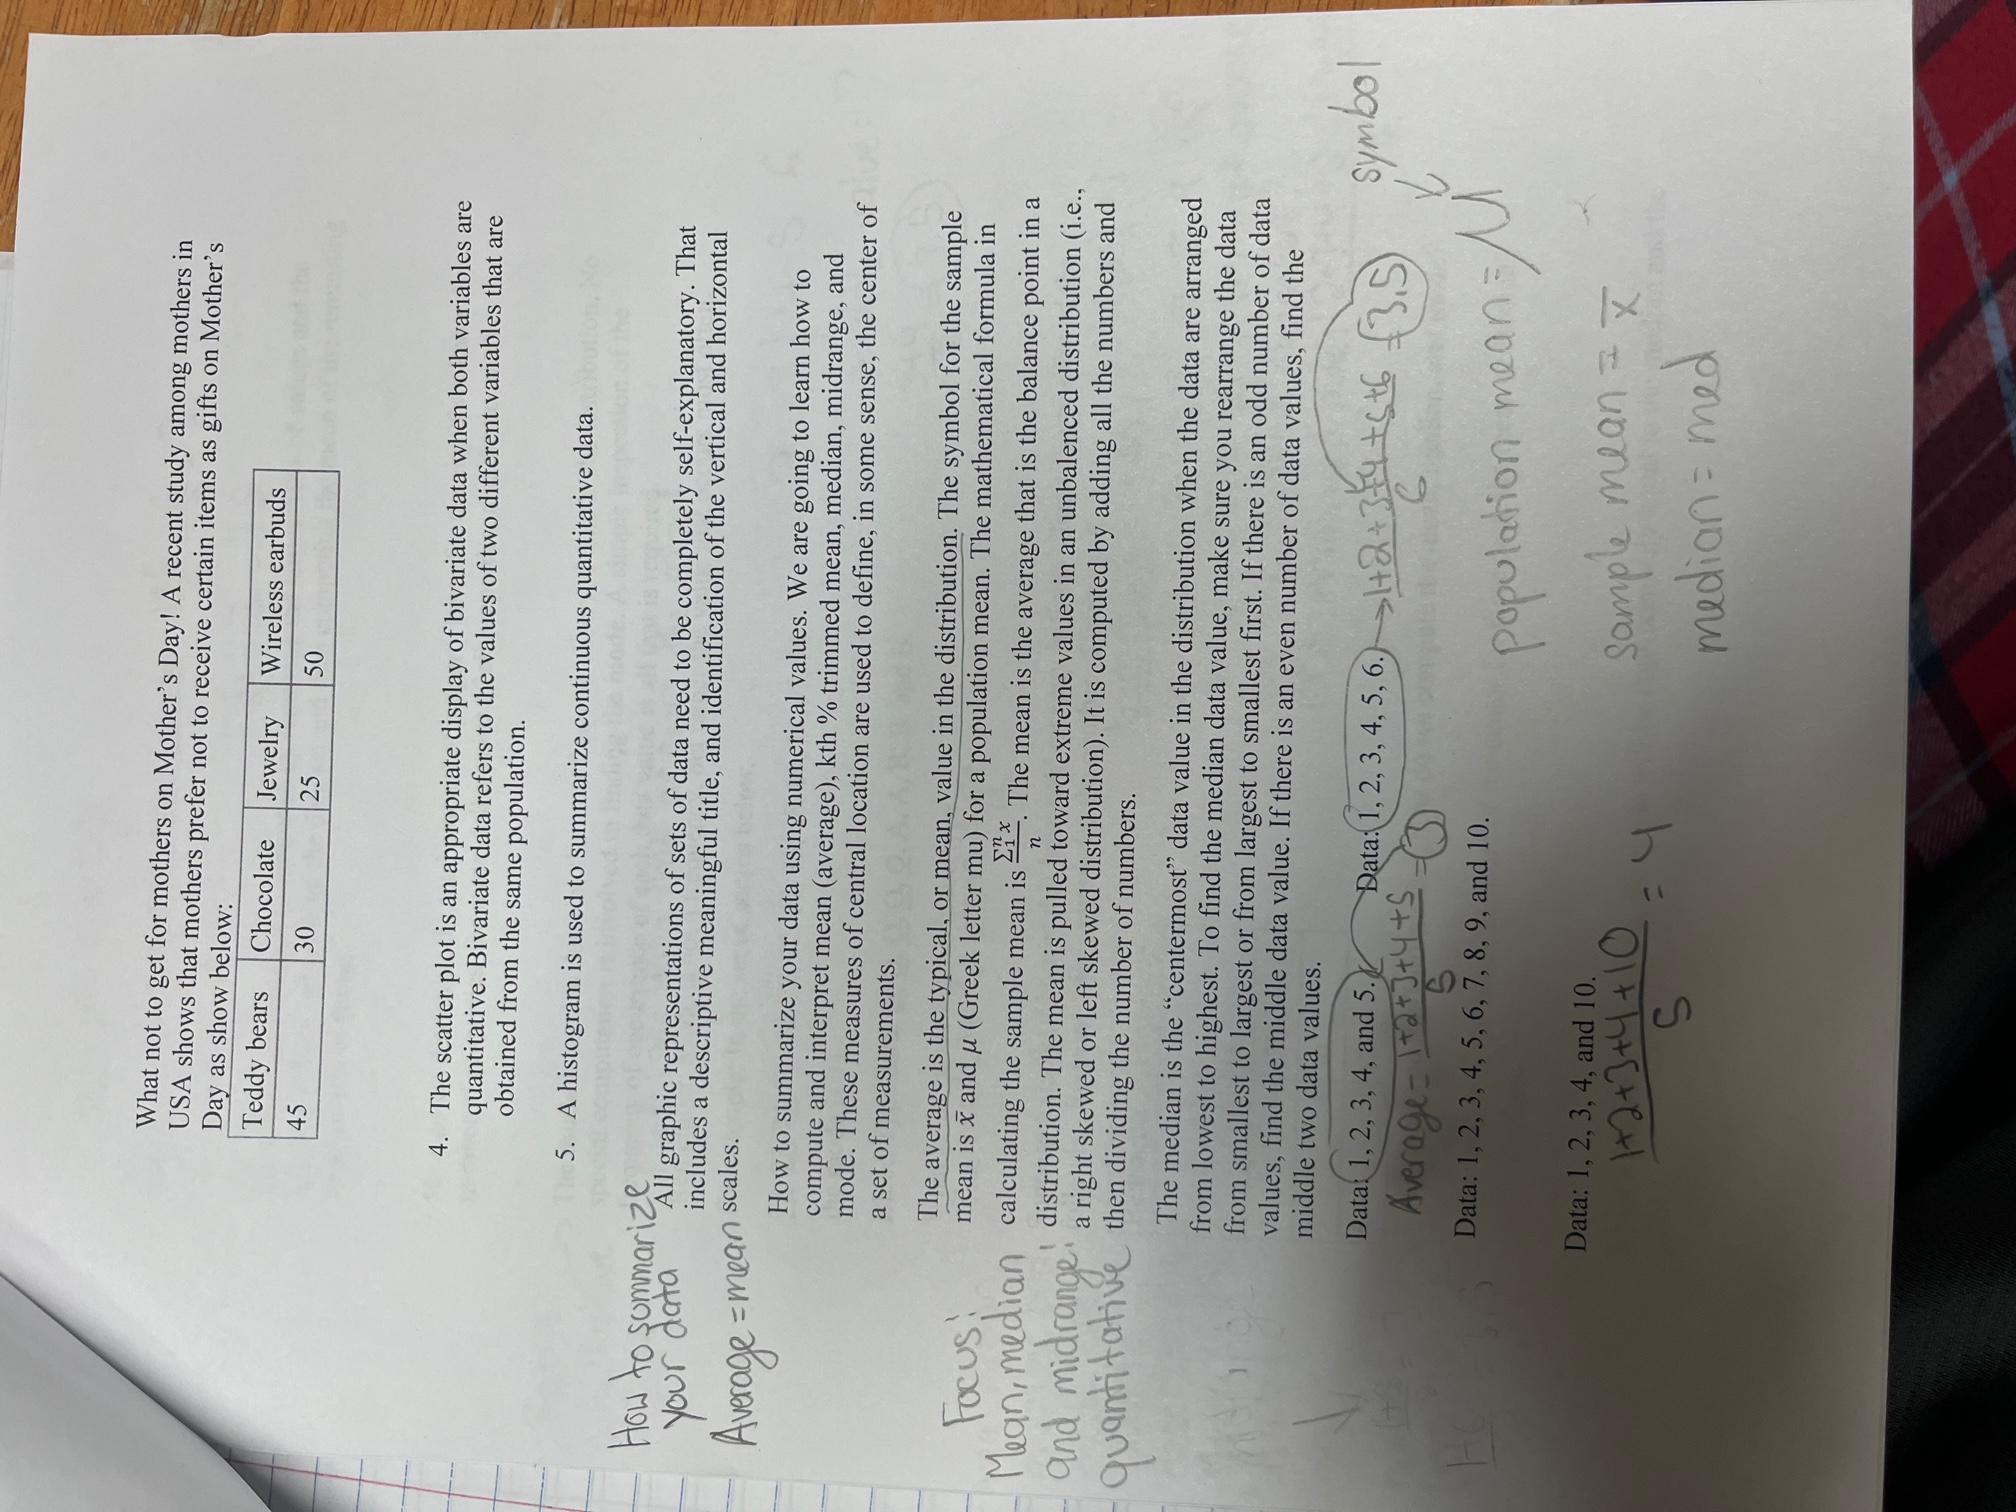
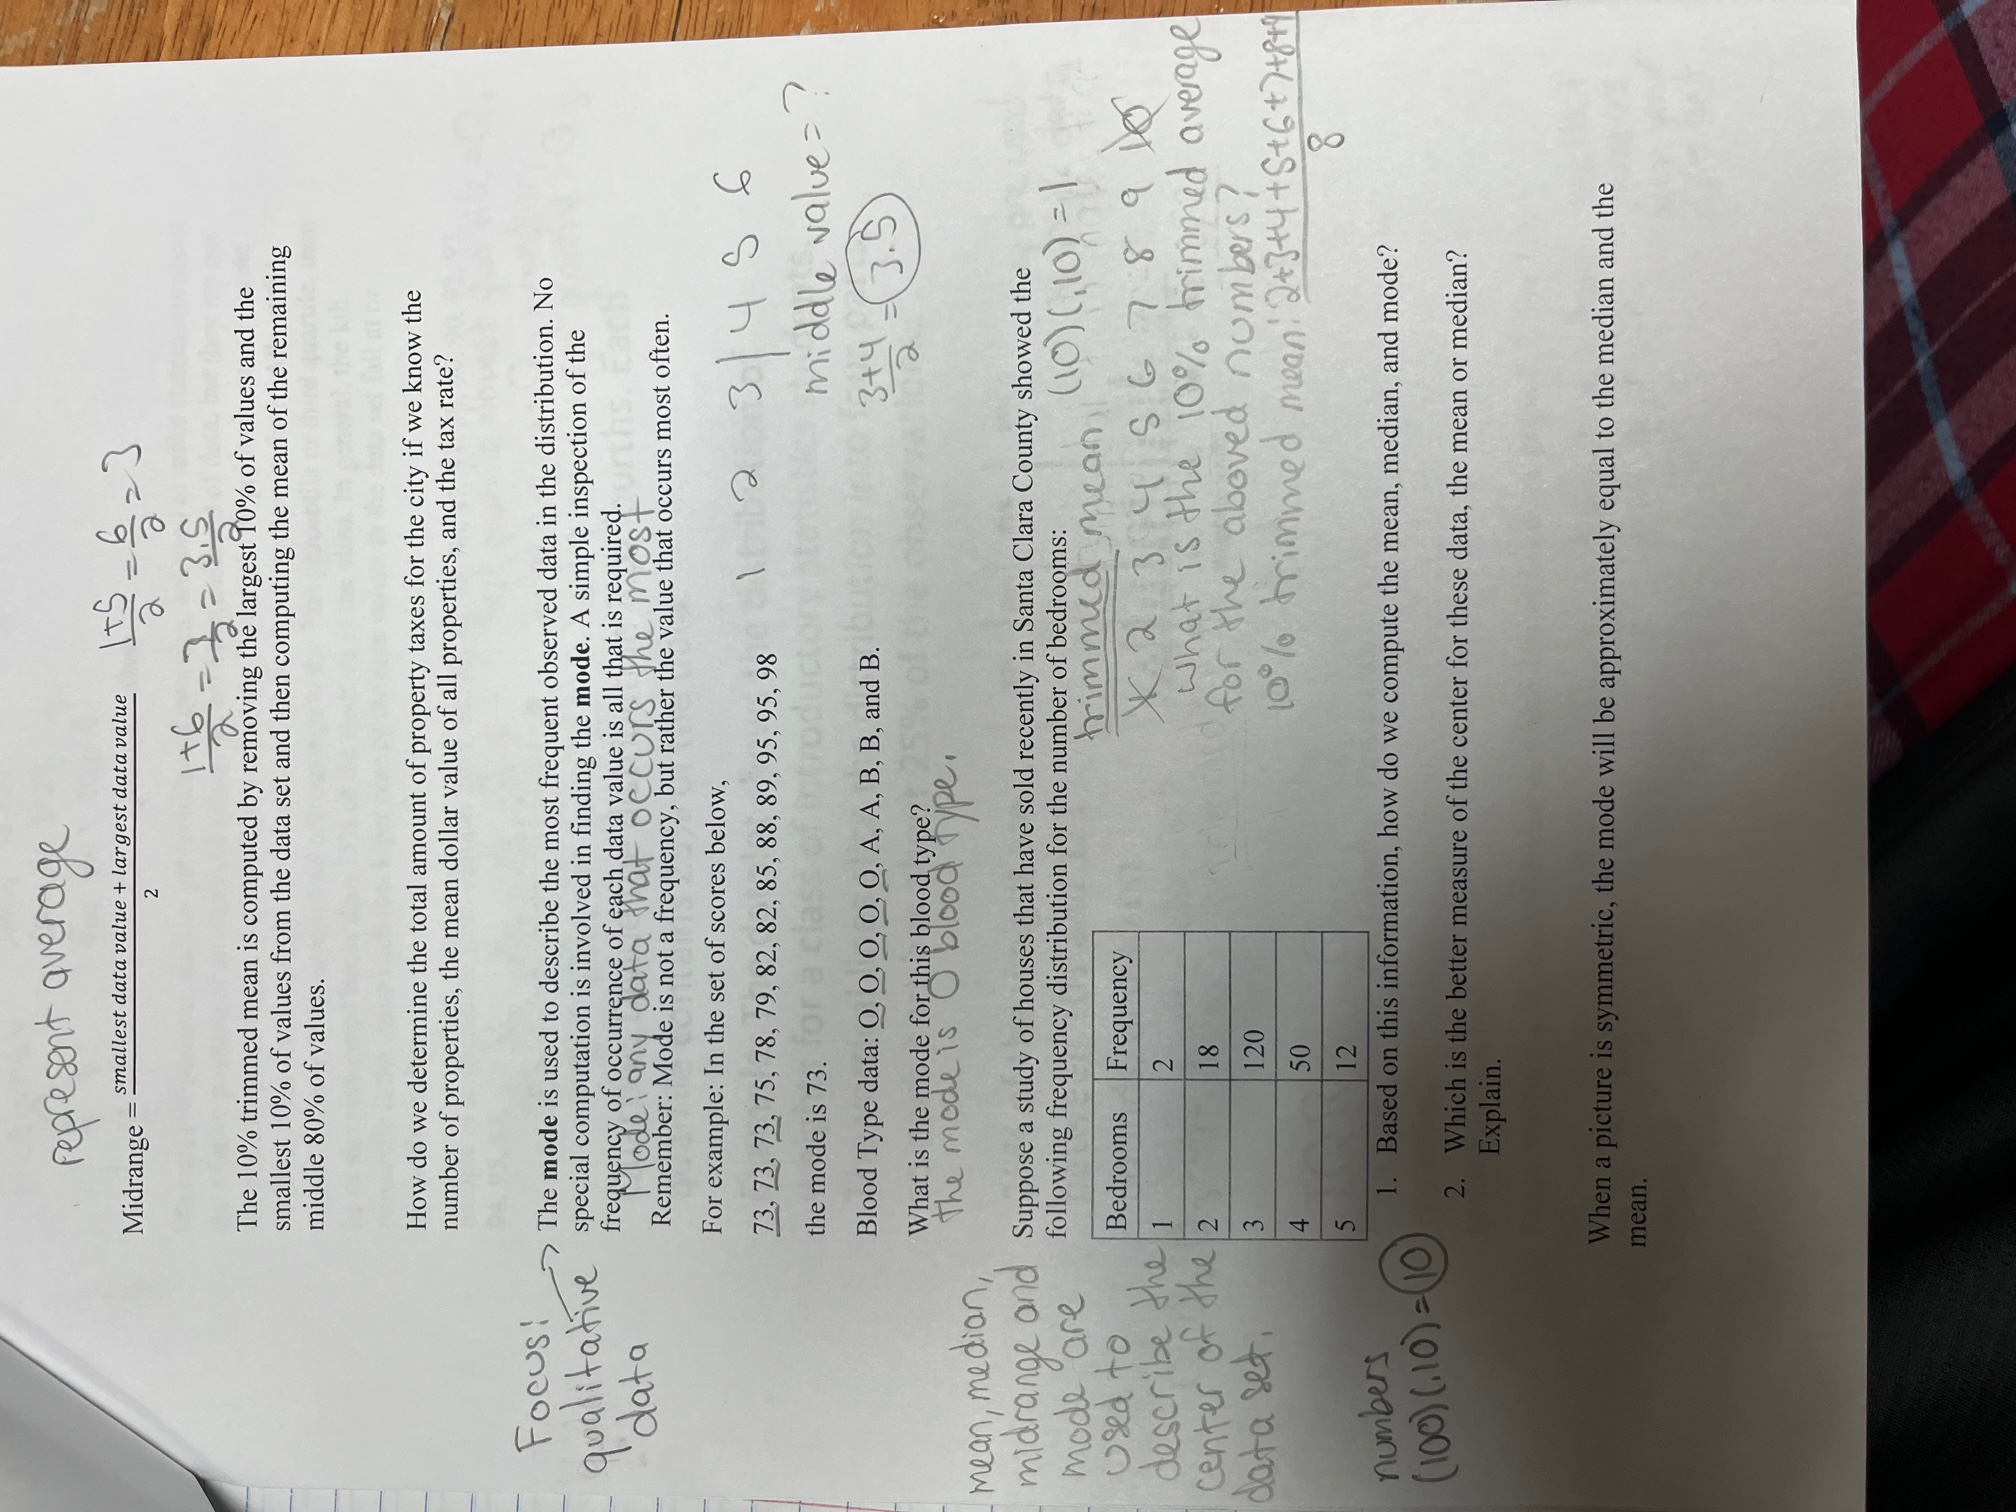
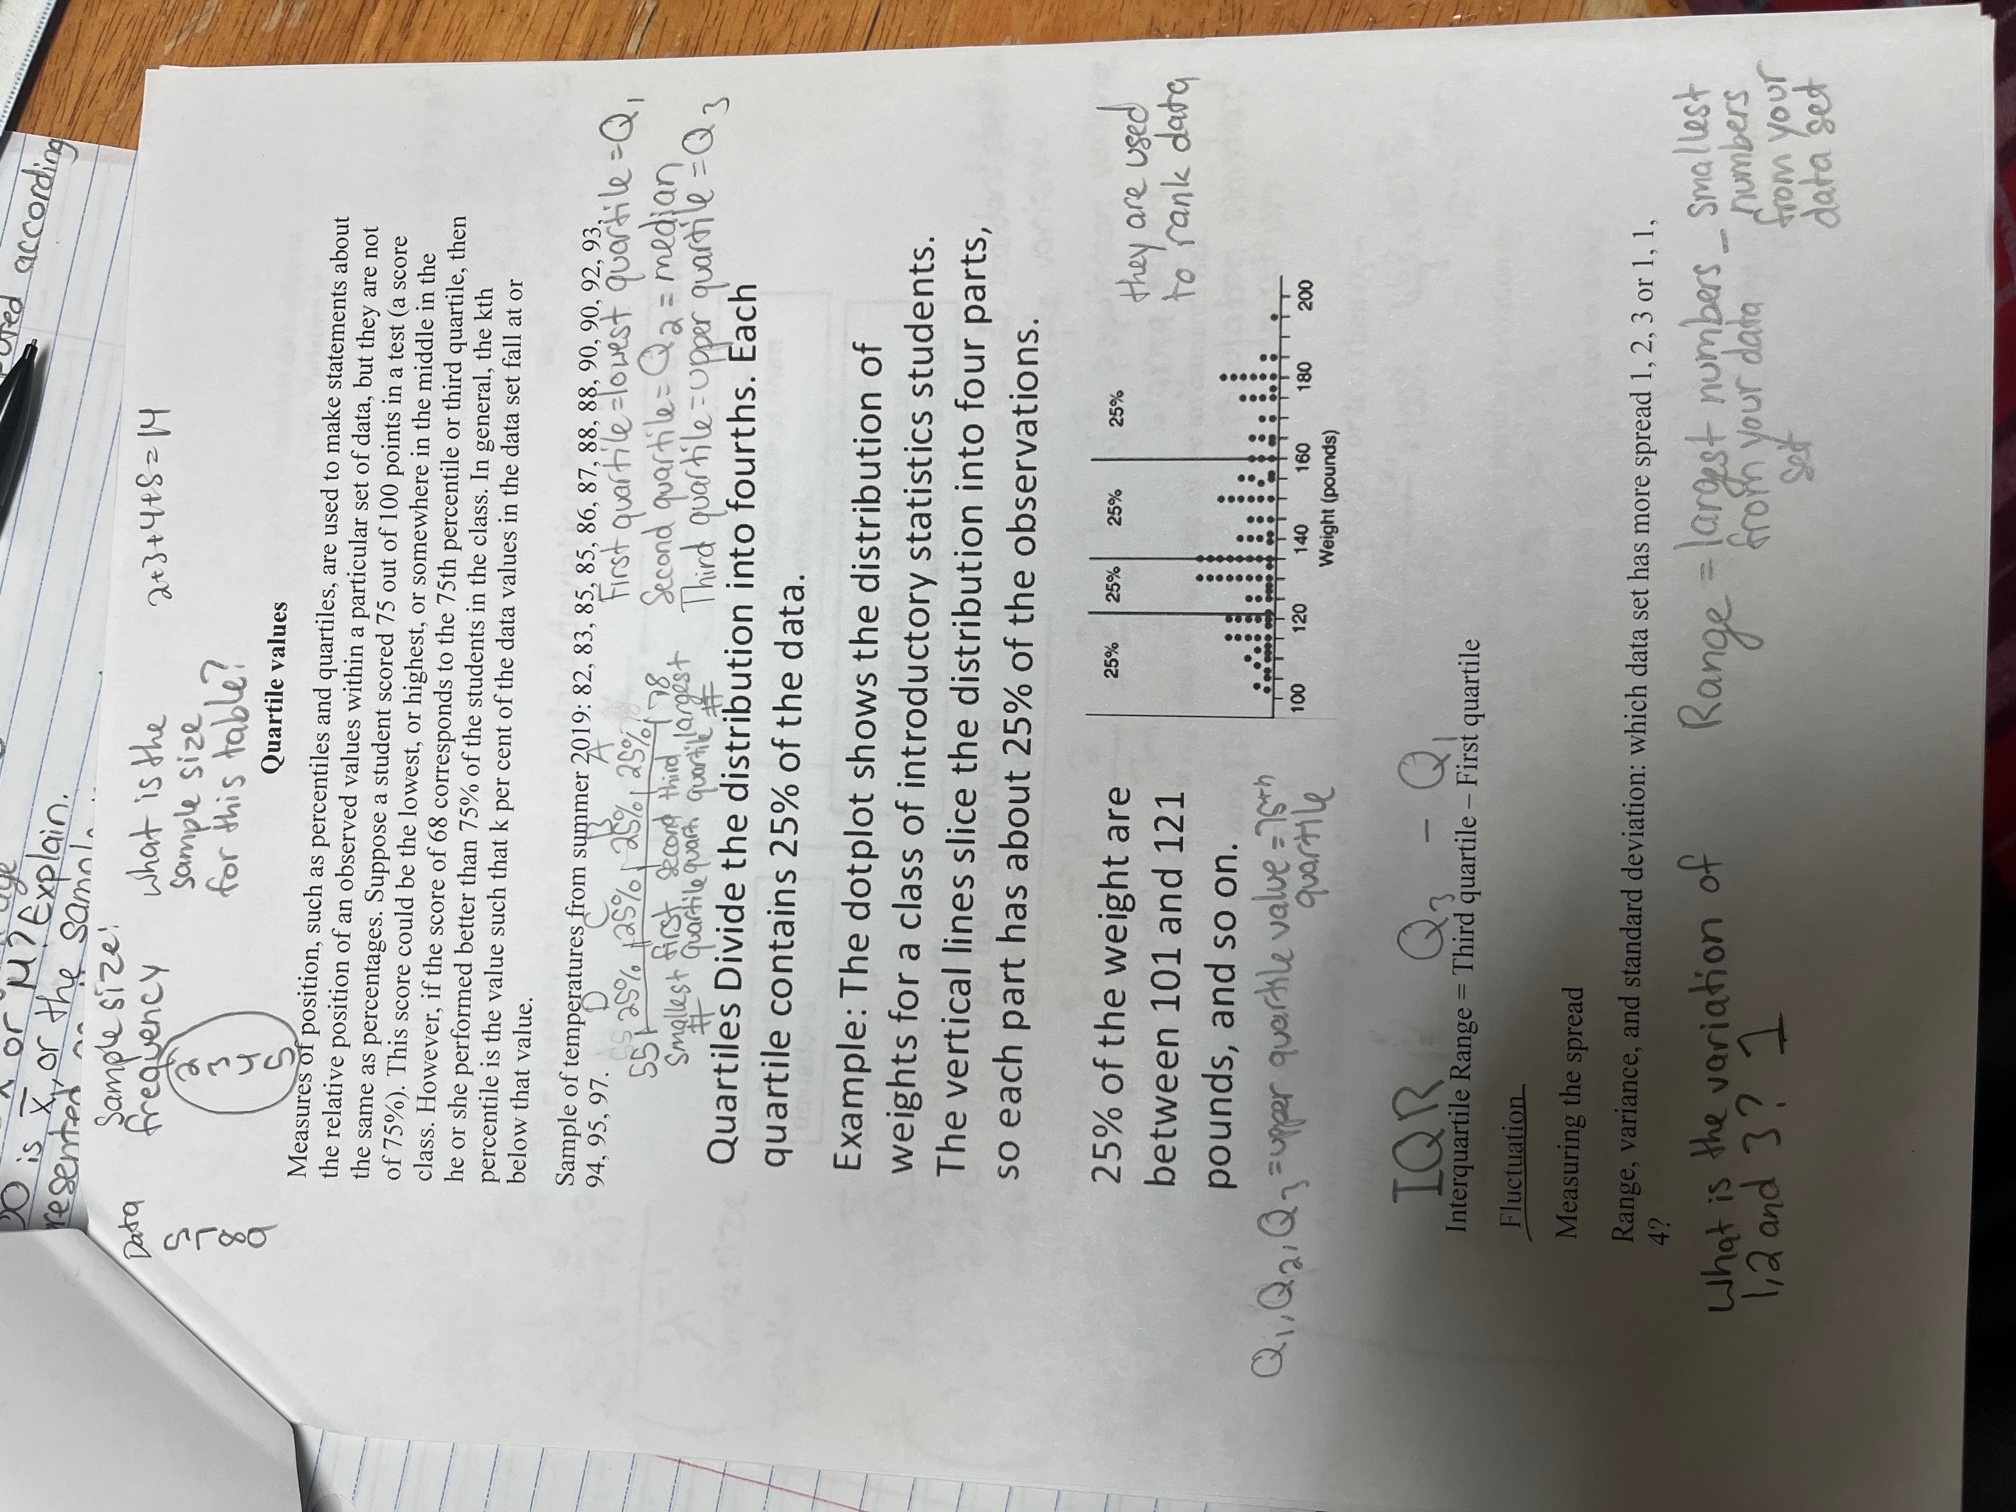
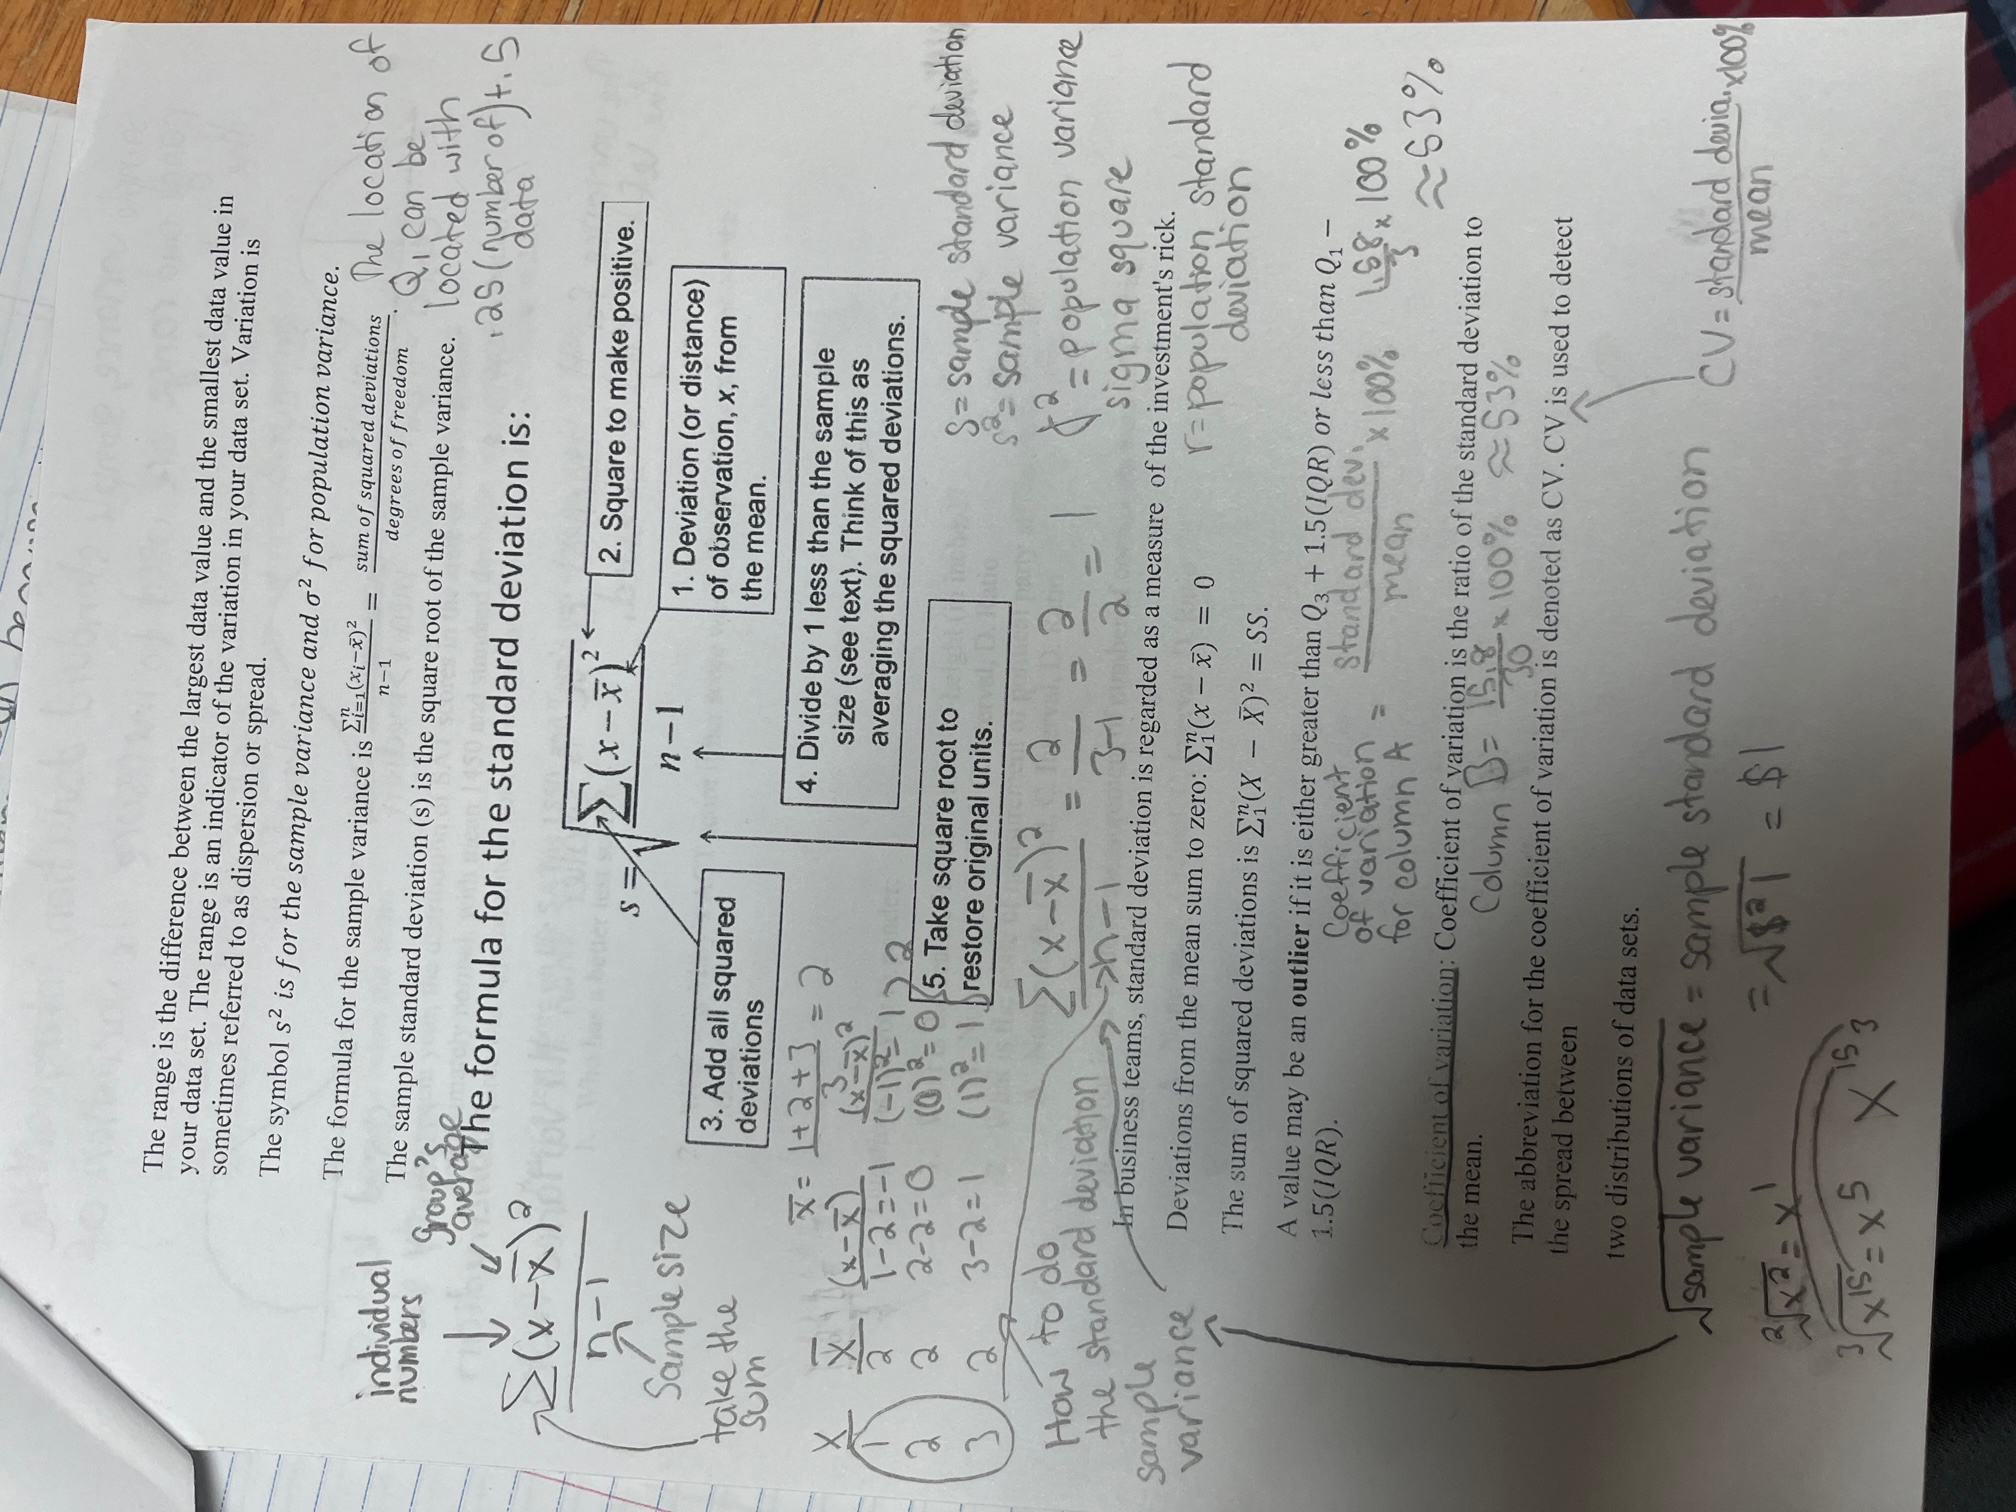
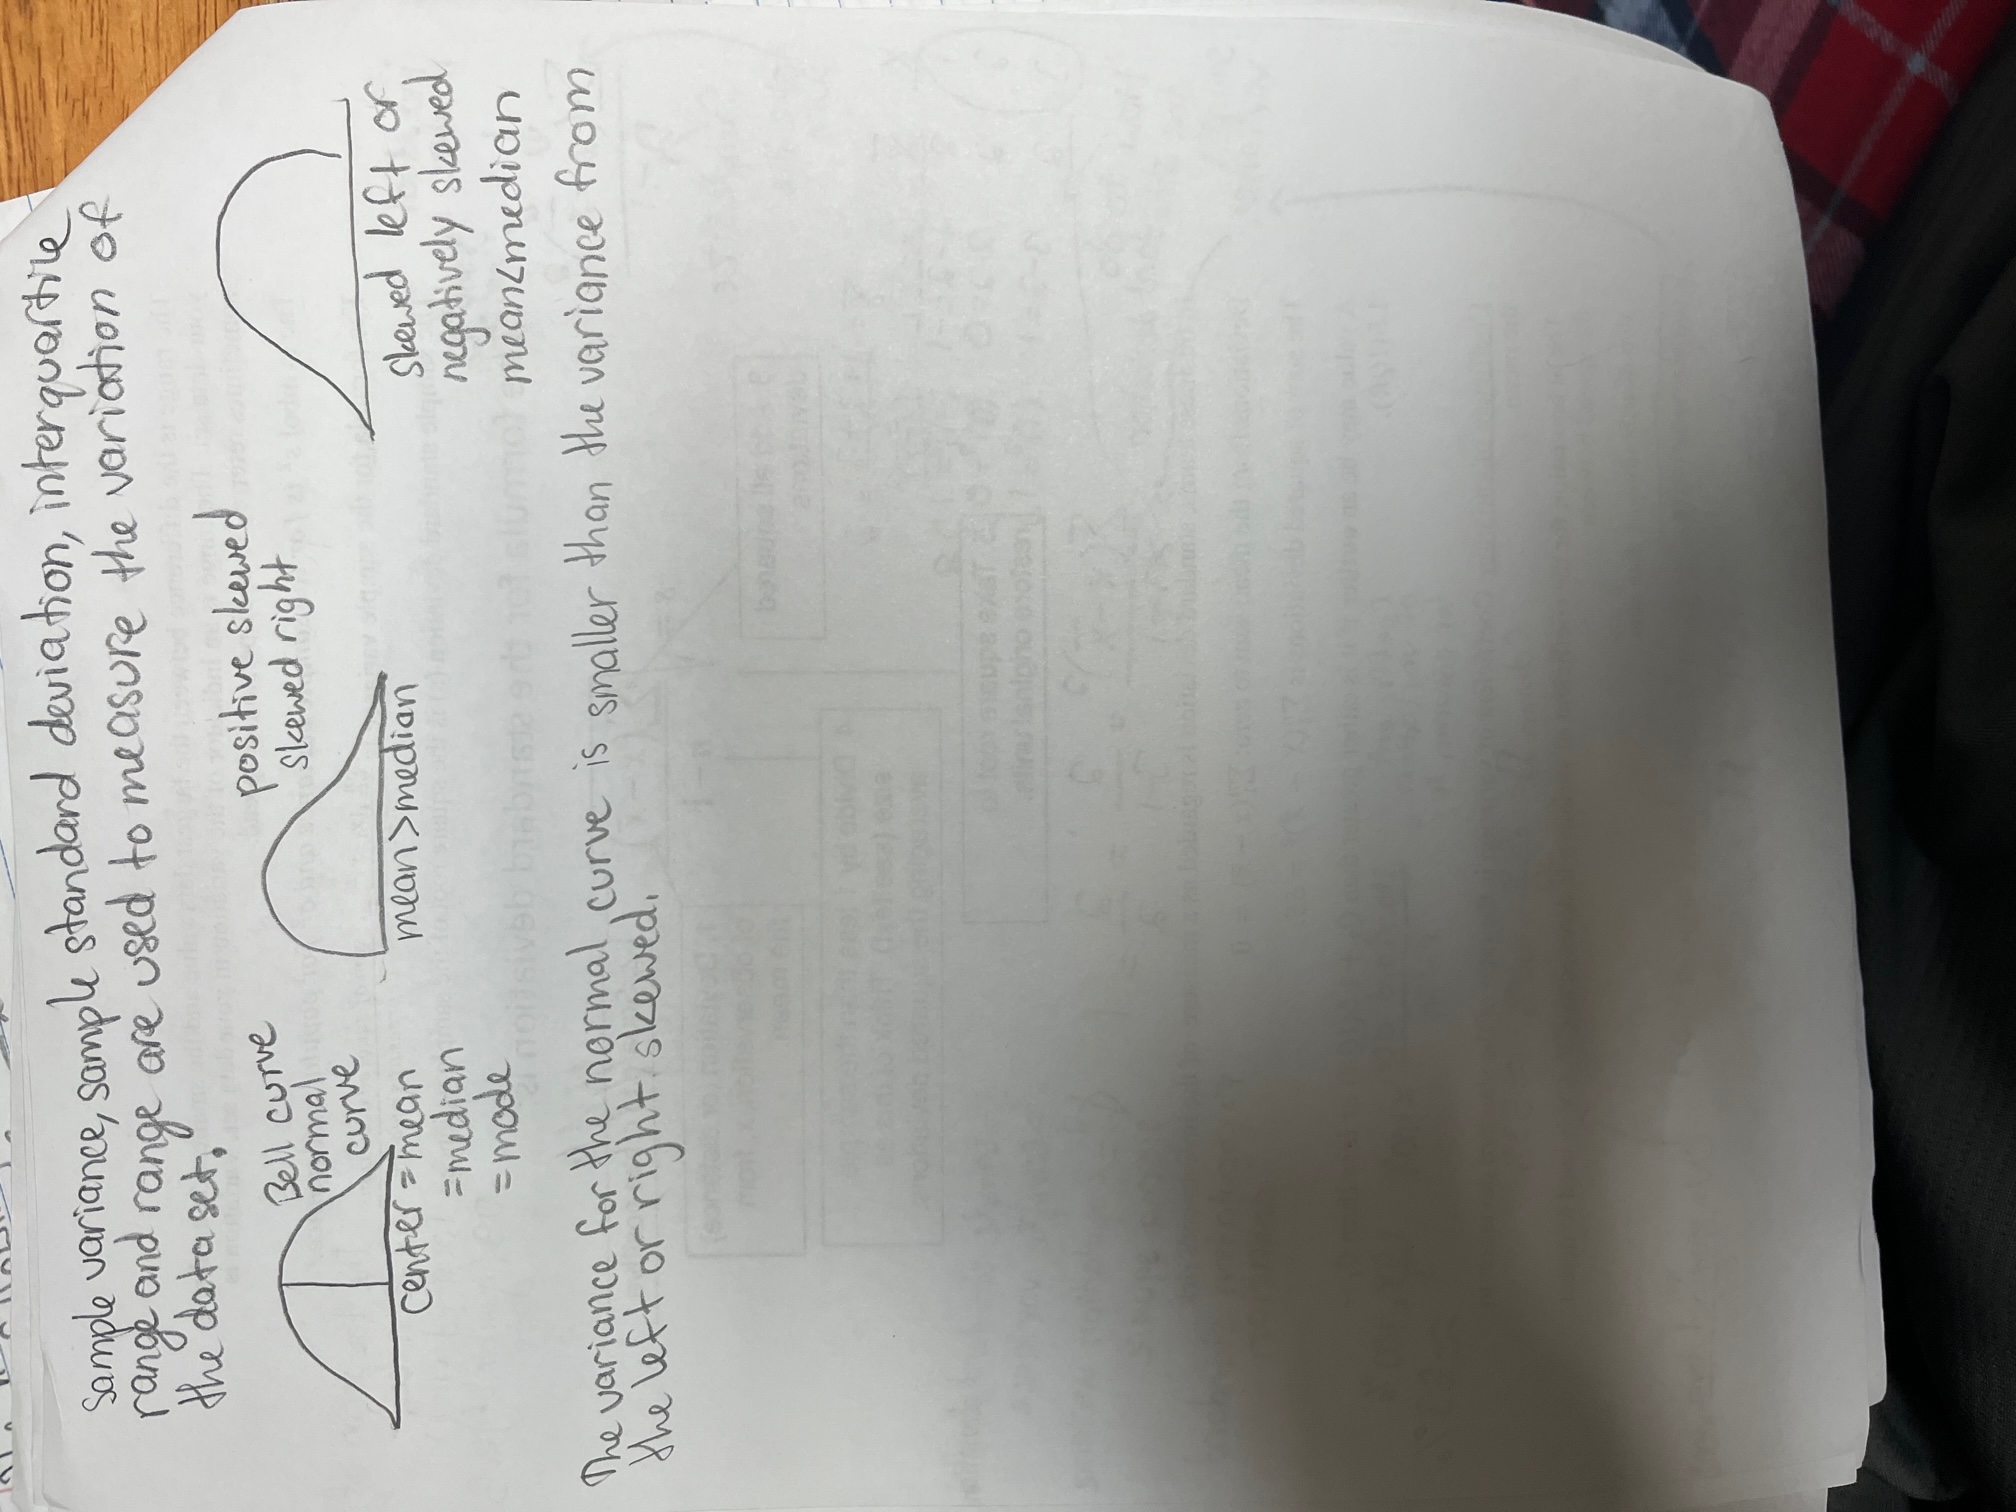
6. The human intelligence quotient, or IO, is computed according to the following formula: 10 =- tar Mental Age -x 100. m sigo Chronological Age mobna A The Mental Age part of the formula is measured by reputable mental tests such as the Stanford-Binet or the MMPI (Minnesota Multiple Personality Inventory). The Chronological Age is simply the natural age. On average, Mental Age = Chronological Age; thus, the average IQ is set at 100. It is known that the distribution of IO for adults follows a normal or bell shaped distribution with an average of 100 and a standard deviation of 15. a. Is 100 x or u ? Explain. .010S inox eff nil elidw 000 (D) ni sonsled ogmovs belamiles off b. Is 15 s or o? Explain. allege baseball tearn tonudidalb ord to ogerda adl el is tv c. What is the variance of the IO distribution? asled maiborn bus agmovs sill sis ydWd d. Give a rough sketch of the IO distribution. mel olana ardted S-croonbed & to going zole onT e9. The sales price of 3 bedroom-2 baths single family homes not exceeding 1500 sq. ft. of living space in Santa Clara County over a period of one year are summarized in the table below: Sales Price $300K $400K $500K $600K $700K $800K $90OK $1.0M $1.1M $1.2M Percent of 8% 10% 12% 21% 15% 15% 10% 6% 2% 1% home sales a. In a random sample of 100 such homes, how many are expected to sell for at least $700K? b. Find the median sales price for the homes. c. What is the shape of the distribution of sales price? Explain why. 2 - 68d. Is a selling price of $1.2M an outlier? Answer Yes or No and give numerical justification. 10. On an unusually difficult Physics exam, the class average was 25 (out of 100) with a standard deviation of 10. Peter obtained a score of 15. That score was good enough to earn a C. The professor was embarrassed to publicize the results of the exam. He preferred for the average to be 60 and the standard deviation to be 20. So, he calls on you and asks: is there a way to transform all the exam scores so that the average of the transformed scores is 60 with a standard deviation of 20? a. How would you do it? Explain. b. After the exam scores were transformed, what was Peter's score? 11. SRS's of size 35 each are obtained from two populations, call them population I and II. The stem-leaf for each of the samples is given below: Sample from Sample from population I population II Legend 1 1 = 11 Stem Leaf Stem Leaf 1 8 22222 lity an 12 3 5 uonS 3 3 3 3 3 .VanAw 23679 VAUAWN- 44444 1 3 5 5 8 8 8 8 9 9 9 99 8 8 8 8 8 4 4579 5 5 2 : 6 6 6 6 6 9 a. Without computing, which of the two samples has the largest variance? Explain why. Verify your answer from part a by computing the sample variance for each of the two samples. c. Describe the shape of the sample data for each of the two samples. 12. The box-plots below give the weights, in pounds, of players in two college baseball teams. A B 140 155 160 165 175 180 225 240 Weight, in pounds 2 - 69 or - s roing beinga. Describe the shape of each distribution. bhis 6 b. About 25% of the players in team B have weights above c. The middle 50% percent of the weights for team B players falls between and bonolig OH mixs .d. Is the heaviest player in team A an outlier? Numerically justify your answer. ob wov bluoz wall ation of the U.S was 281 AT It Bus t Honslugg marks liss jenoitsingog owt mont bealaido 928 riggo ZE asia To beste 5 woled navig di golgise and To dono ial test-masjeThis chapter explores data analysis in the form of graphical displays (dotplots, stem-leaf plots, box-plots, histograms), center, spread, identifying unusual observations and convey). summarizing data ( with added emphasis on explaining the message the appears to Shape is one of the basic characteristics used to describe a distribution of your data. Most distributed). distributions can be classified either skewed right, skewed left, or symmetrical (normally Shape: Symmetric Symmetric Left and right side roughly the same Histogram is used for continuous data normal Frequency Curve Bar chart Used for categorical data or discrete X -data Shape ( ex. mom Distribution skewed right skewed left candy positively negatively skewed counting left normal skewed distribution head Hail ' right head tail Bell curve rectangular distributor or uniform distribution to predict the futureSkewed Most of the data is on one side with a long tail (or skew) on the other side 40 - 20 - 30 15 - Frequency Frequency 20 10 10 5 12 24 36 48 10 15 20 25 30 Hours of TV per Week Grade (out of 32) We are going to learn how to summarize and describe the distribution of data using graphs. 1. Dotplot displays the data of a sample by representing each data with a dot positioned along a horizontal scale, and the frequency on the vertical scale. This display is a convenient technique to use as you first begin to analyze the data. Use dotplot to display the following data set: 4,4, 4.7, 4.7, 7.7, 5.1, 5.1, 5.1, 5.1, 5.1. 8 2. The Stem-and-leaf display is a combination of a graphical technique and a sorting technique in statistics, and it is well suited to computer applications. (Jime-series) - xy plot, scatter plot Use stem-and-leaf display to summarize the following data set: 10, 10, 11, 12, 14, 14, 15, 20, 21, 21, 21, 22, 25, 30, 30, 34. 3. Pie chart and bar chart are graphs that are used to summarize qualitative data.What not to get for mothers on Mother's Day! A recent study among mothers in USA shows that mothers prefer not to receive certain items as gifts on Mother's Day as show below: Teddy bears Chocolate Jewelry Wireless earbuds 45 30 25 50 4. The scatter plot is an appropriate display of bivariate data when both variables are quantitative. Bivariate data refers to the values of two different variables that are obtained from the same population. 5. A histogram is used to summarize continuous quantitative data. How to summarize your data All graphic representations of sets of data need to be completely self-explanatory. That includes a descriptive meaningful title, and identification of the vertical and horizontal Average= mean scales. How to summarize your data using numerical values. We are going to learn how to compute and interpret mean (average), kth % trimmed mean, median, midrange, and mode. These measures of central location are used to define, in some sense, the center of a set of measurements. The average is the typical, or mean, value in the distribution. The symbol for the sample Focus! mean is x and u (Greek letter mu) for a population mean. The mathematical formula in Mean, median calculating the sample mean is . The mean is the average that is the balance point in a and midrange! distribution. The mean is pulled toward extreme values in an unbalenced distribution (i.e., a right skewed or left skewed distribution). It is computed by adding all the numbers and quantitative then dividing the number of numbers. The median is the "centermost" data value in the distribution when the data are arranged from lowest to highest. To find the median data value, make sure you rearrange the data from smallest to largest or from largest to smallest first. If there is an odd number of data values, find the middle data value. If there is an even number of data values, find the middle two data values. Data( 1, 2, 3, 4, and 5. Data:(1, 2, 3, 4, 5, 6.) 1+2+3-4 +5+6 ( 3.5) symbol Average = 1+2+ 3+ 4+s Data: 1, 2, 3, 4, 5, 6, 7, 8, 9, and 10. Population mean = Data: 1, 2, 3, 4, and 10. 12+ 3+4 + 10 sample mean = x Ey S median = medrepresent average Midrange = smallest data value + largest data value Its 6 2 3 2 1+6 - 7 = 3. 5 The 10% trimmed mean is computed by removing the largest TO% of values and the smallest 10% of values from the data set and then computing the mean of the remaining middle 80% of values. How do we determine the total amount of property taxes for the city if we know the number of properties, the mean dollar value of all properties, and the tax rate? Focus ! The mode is used to describe the most frequent observed data in the distribution. No qualitative special computation is involved in finding the mode. A simple inspection of the data frequency of occurrence of each data value is all that is required. lode ! any data that occurs the most Remember: Mode is not a frequency, but rather the value that occurs most often. For example: In the set of scores below, 73, 73, 73, 75, 78, 79, 82, 82, 85, 88, 89, 95, 95, 98 1012 3 4 5 6 the mode is 73. middle value = ? Blood Type data: O, O, O, O, O, A, A, B, B, and B. 3+ 4 3.5 What is the mode for this blood type? 2 mean , median, The mode is blood type. midrange and Suppose a study of houses that have sold recently in Santa Clara County showed the mode are following frequency distribution for the number of bedrooms: ( 10 ) (, 10 ) = 1 used to Bedrooms Frequency trimmed mean , describe the 1 2 X 2 3 4 5 6 78 9 15 center of the 2 18 what is the 10% trimmed average data set W 120 for the aboved numbers ? 4 50 10 trimmed mean: 2+3+4+5+6+7+8+9 12 8 numbers ( 100) (.10 ) = ( 10 1. Based on this information, how do we compute the mean, median, and mode? 2. Which is the better measure of the center for these data, the mean or median? Explain. When a picture is symmetric, the mode will be approximately equal to the median and the mean.or M/ Explain . fed according 10 is x or the samal. .. resented An Sample size! Data frequency what is the 2+ 3+4+8 =14 sample size for this table? Quartile values Measures of position, such as percentiles and quartiles, are used to make statements about the relative position of an observed values within a particular set of data, but they are not the same as percentages. Suppose a student scored 75 out of 100 points in a test (a score of 75%). This score could be the lowest, or highest, or somewhere in the middle in the class. However, if the score of 68 corresponds to the 75th percentile or third quartile, then he or she performed better than 75% of the students in the class. In general, the kth percentile is the value such that k per cent of the data values in the data set fall at or below that value. Sample of temperatures from summer 2019: 82, 83, 85, 85, 86, 87, 88, 88, 90, 90, 92, 93, 94, 95, 97. D 55725% 25% 25% 251 8 first quartile = lowest quartile = Q, + first second third smallest quartile quart quarti, largest Second quartile = Q2 = median Third quartile = upper quartile = Q 3 Quartiles Divide the distribution into fourths. Each quartile contains 25% of the data. Example: The dotplot shows the distribution of weights for a class of introductory statistics students. The vertical lines slice the distribution into four parts, so each part has about 25% of the observations. 25% of the weight are 25% 25% 25% 25% they are used between 101 and 121 to rank data pounds, and so on. Qi, Q 2, Q , = upper quartile value = 75th quartile 100 120 140 160 180 200 Weight (pounds) IQR Q - Q Interquartile Range = Third quartile - First quartile Fluctuation Measuring the spread Range, variance, and standard deviation: which data set has more spread 1, 2, 3 or 1, 1, 4 ? What is the variation of Range = largest numbers smallest from your data numbers 1,2 and 3 ? 1 from your Set data setDenni.na The range is the difference between the largest data value and the smallest data value in your data set. The range is an indicator of the variation in your data set. Variation is sometimes referred to as dispersion or spread. The symbol s2 is for the sample variance and o2 for population variance. The formula for the sample variance is (*1-2)2 sum of squared deviations The location of individual n - 1 degrees of freedom Q, can be numbers Group'S The sample standard deviation (s) is the square root of the sample variance. located with aver The formula for the standard deviation is: 25 ( number of )+.5 data I( x - x ) ? n - 1 E( x -F ) 2. Square to make positive. Sample size n-1 1. Deviation (or distance) 3. Add all squared of observation, x, from take the the mean. sum deviations X = 1+2+3 = 2 4. Divide by 1 less than the sample X ( x - X ) (x - x ) 2 size (see text). Think of this as 2 1-2=-1 averaging the squared deviations. 2 2-2= 0 (0)8= 0 5. Take square root to S = sample standard deviation 2 3- 2 = 1 (1) = 1restore original units. so= sample variance How to do 2( x-x )? 2 2 = population variance the standard deviation 3 -1 sigma square sample In business teams, standard deviation is regarded as a measure of the investment's rick. variance Deviations from the mean sum to zero: ET(x - x) = 0 r= population standard deviation The sum of squared deviations is En(X - X)2 = SS. A value may be an outlier if it is either greater than Q3 + 1.5(1QR) or less than Q1 - 1.5 (1QR). Coefficient of variation = standard devi - * 100% 168 x 100 % for column A mean 253% Coefficient of variation: Coefficient of variation is the ratio of the standard deviation to the mean. Column 1= 1518x 100% 53% The abbreviation for the coefficient of variation is denoted as CV. CV is used to detect the spread between two distributions of data sets. "sample variance = sample standard deviation CV= standard devia xloog = NBaT = $1 mean NX15 = X5 XSample variance, sample standard deviation, interquartile range and range are used to measure the variation of the data set, Bell curve positive skewed normal skewed right curve center = mean mean >median = median skewed left or = mode negatively skewed isiveb biebasie s meanmedian The variance for the normal, curve is smaller than the variance from the left or right skewed
Step by Step Solution
There are 3 Steps involved in it

Get step-by-step solutions from verified subject matter experts


