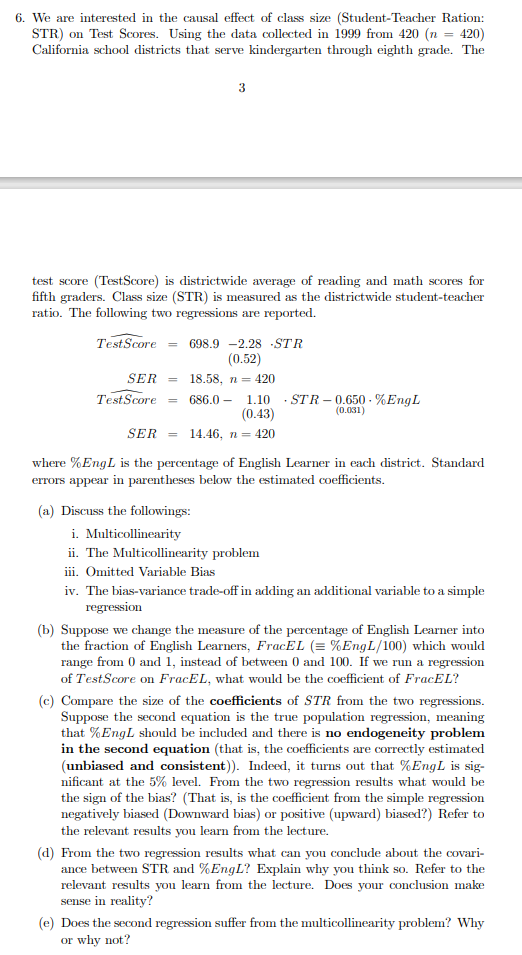
6. We are interested in the causal effect of class size (Student-Teacher Ration: STR) on Test Scores. Using the data collected in 1999 from 420 (n = 420) California school districts that serve kindergarten through eighth grade. The 3 test score (TestScore) is districtwide average of reading and math scores for fifth graders. Class size (STR) is measured as the districtwide student-teacher ratio. The following two regressions are reported. Test Score = 698.9 -2.28 STR (0.52) SER 18.58, n = 420 Test Score 686.0 - 1.10 STR-0.650. %Engl (0.43) (0.031) SER 14.46, n = 420 where % Engl is the percentage of English Learner in each district. Standard errors appear in parentheses below the estimated coefficients. (a) Discuss the followings: i. Multicollinearity ii. The Multicollinearity problem iiiOmitted Variable Bias iv. The bias-variance trade-off in adding an additional variable to a simple regression (b) Suppose we change the measure of the percentage of English Learner into the fraction of English Learners, FracEL E%EngL/100) which would range from 0 and 1, instead of between 0 and 100. If we run a regression of Test Score on FracEL, what would be the coefficient of FracEL? (c) Compare the size of the coefficients of STR from the two regressions. Suppose the second equation is the true population regression, meaning that % Engl should be included and there is no endogeneity problem in the second equation that is, the coefficients are correctly estimated (unbiased and consistent). Indeed, it turns out that %Engl is sig- nificant at the 5% level. From the two regression results what would be the sign of the bias? (That is, is the coefficient from the simple regression negatively biased (Downward bias) or positive (upward) biased?) Refer to the relevant results you learn from the lecture. (d) From the two regression results what can you conclude about the covari- ance between STR and %EngL? Explain why you think so. Refer to the relevant results you learn from the lecture. Does your conclusion make sense in reality? (e) Does the second regression suffer from the multicollinearity problem? Why or why not? 6. We are interested in the causal effect of class size (Student-Teacher Ration: STR) on Test Scores. Using the data collected in 1999 from 420 (n = 420) California school districts that serve kindergarten through eighth grade. The 3 test score (TestScore) is districtwide average of reading and math scores for fifth graders. Class size (STR) is measured as the districtwide student-teacher ratio. The following two regressions are reported. Test Score = 698.9 -2.28 STR (0.52) SER 18.58, n = 420 Test Score 686.0 - 1.10 STR-0.650. %Engl (0.43) (0.031) SER 14.46, n = 420 where % Engl is the percentage of English Learner in each district. Standard errors appear in parentheses below the estimated coefficients. (a) Discuss the followings: i. Multicollinearity ii. The Multicollinearity problem iiiOmitted Variable Bias iv. The bias-variance trade-off in adding an additional variable to a simple regression (b) Suppose we change the measure of the percentage of English Learner into the fraction of English Learners, FracEL E%EngL/100) which would range from 0 and 1, instead of between 0 and 100. If we run a regression of Test Score on FracEL, what would be the coefficient of FracEL? (c) Compare the size of the coefficients of STR from the two regressions. Suppose the second equation is the true population regression, meaning that % Engl should be included and there is no endogeneity problem in the second equation that is, the coefficients are correctly estimated (unbiased and consistent). Indeed, it turns out that %Engl is sig- nificant at the 5% level. From the two regression results what would be the sign of the bias? (That is, is the coefficient from the simple regression negatively biased (Downward bias) or positive (upward) biased?) Refer to the relevant results you learn from the lecture. (d) From the two regression results what can you conclude about the covari- ance between STR and %EngL? Explain why you think so. Refer to the relevant results you learn from the lecture. Does your conclusion make sense in reality? (e) Does the second regression suffer from the multicollinearity problem? Why or why not


