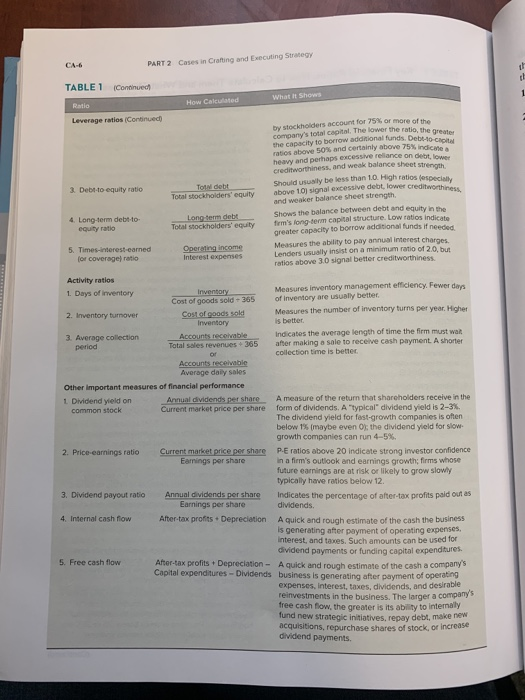
6. What is your assessment of Amazon's financial performance the past three years? (Use the financial ratios in the Appendix of the text as a guide in doing your financial analysis.) PART 2 cases in Crafting and Executing Strategy TABLE 1 Continued What it shows Ratio How Calculated Leverage ratios (Continuech 3. Debito equity ratio Tot debt Total stockholders' equity by stockholders account for 75% or more of the c anvis total cool. The or the ratio, the great the capacity to borrow adanional funds. Debt-10 ch ratios above 50% and certainly above 75% indir heavy and perhaps excessive relance on debt. creditworthiness, and weak balance sheet Street Should usually be less than 1.0. High ratios os above 10 signal excessive debt, lower Creditworth and weaker balance sheet strength Shows the balance between debt and equity in the firm's long term capital structure. Low ratios indicate greater capacity to borrow additional funds if needed Measures the ability to pay annual interest charons Lenders usually insist on a minimum ratio of 2.0, bu ratios above 3.0 signal better creditworthiness 4. Long-term debt-to- equity ratio Long term debt Total stockholders' equity 5. Times-interest-earned for coverage ratio Operating income Interest expenses Activity ratios 1. Days of inventory Inventory Measures inventory management efficiency. Fewer das Cost of goods sold - 365 of inventory are usually better 2. Inventory turnover Costof goods sold Measures the number of inventory turns per year. Higher Inventory is better 3. Average collection Accounts receivable Indicates the average length of time the firm must wait period Total sales revenues 365 after making a sale to receive cash payment A shorter collection time is better Accounts receivable Average daily sales Other important measures of financial performance 1 Dividend veld on Annual dividends per share A measure of the return that shareholders receive in the common stock Current market price per share form of dividends. A typical dividend yield is 2-3% The dividend yield for fast-growth companies is often below 15 maybe even Oy the dividend yield for slow- growth companies can run 4-5% 2. Price-earnings ratio Current market price per share P-E ratios above 20 Indicate strong investor confidence Earnings per share in a firm's outlook and earnings growth; firms whose future earnings are at risk or likely to grow slowly typically have ratios below 12. 3. Dividend payout ratio Annual dividends per share indicates the percentage of after-tax profits paid out as Earnings per share dividends. 4. Internal cash flow After-tax profits + Depreciation A quick and rough estimate of the cash the business is generating after payment of operating expenses. Interest, and taxes. Such amounts can be used for dividend payments or funding capital expenditures. 5. Free cash flow After-tax profits + Depreciation - A quick and rough estimate of the cash a companys Capital expenditures-Dividends business is generating after payment of operating expenses. Interest, taxes, dividends, and desirable reinvestments in the business. The larger a company free cash flow, the greater is its ability to internally fund new strategic initiatives, repay debt, make new acquisitions, repurchase shares of stock, or increase dividend payments


