..............................................................
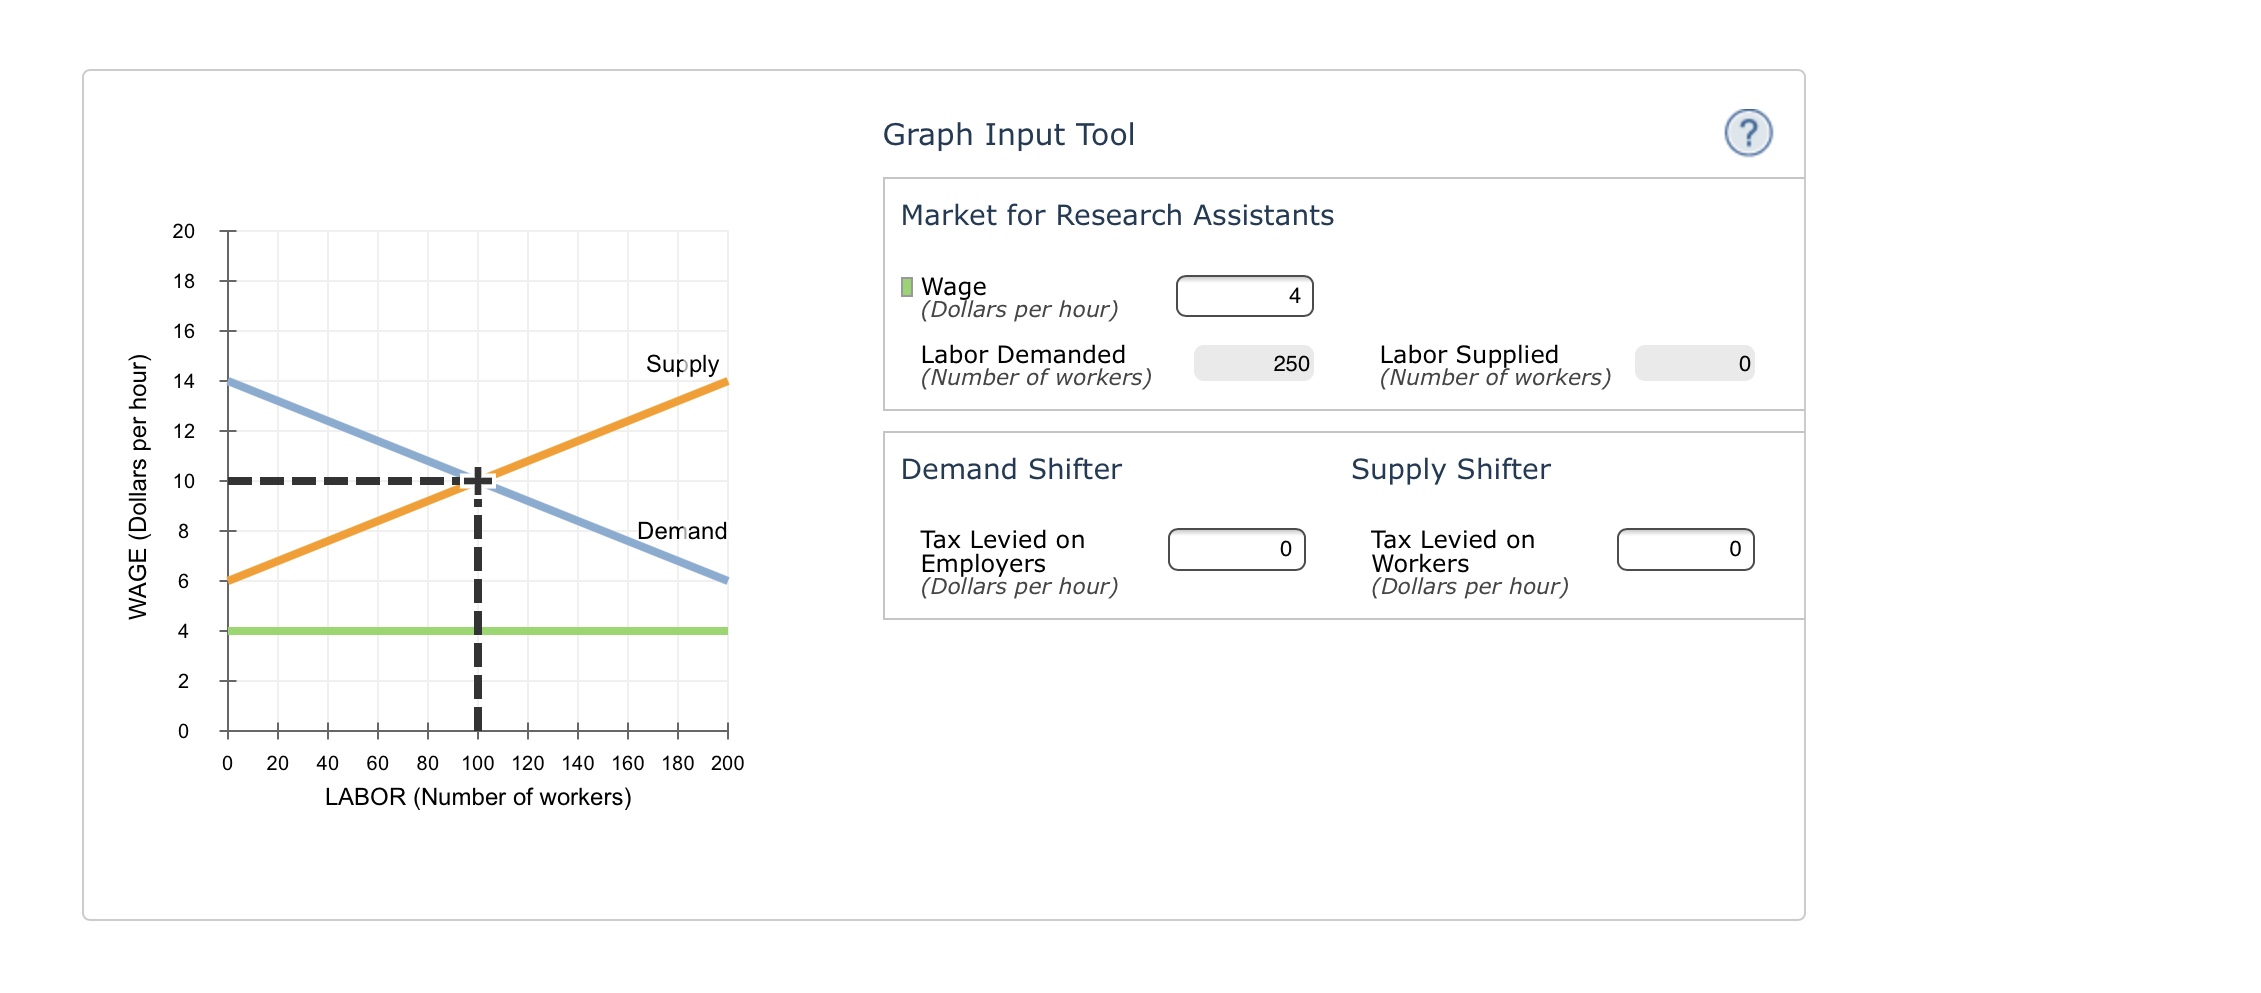
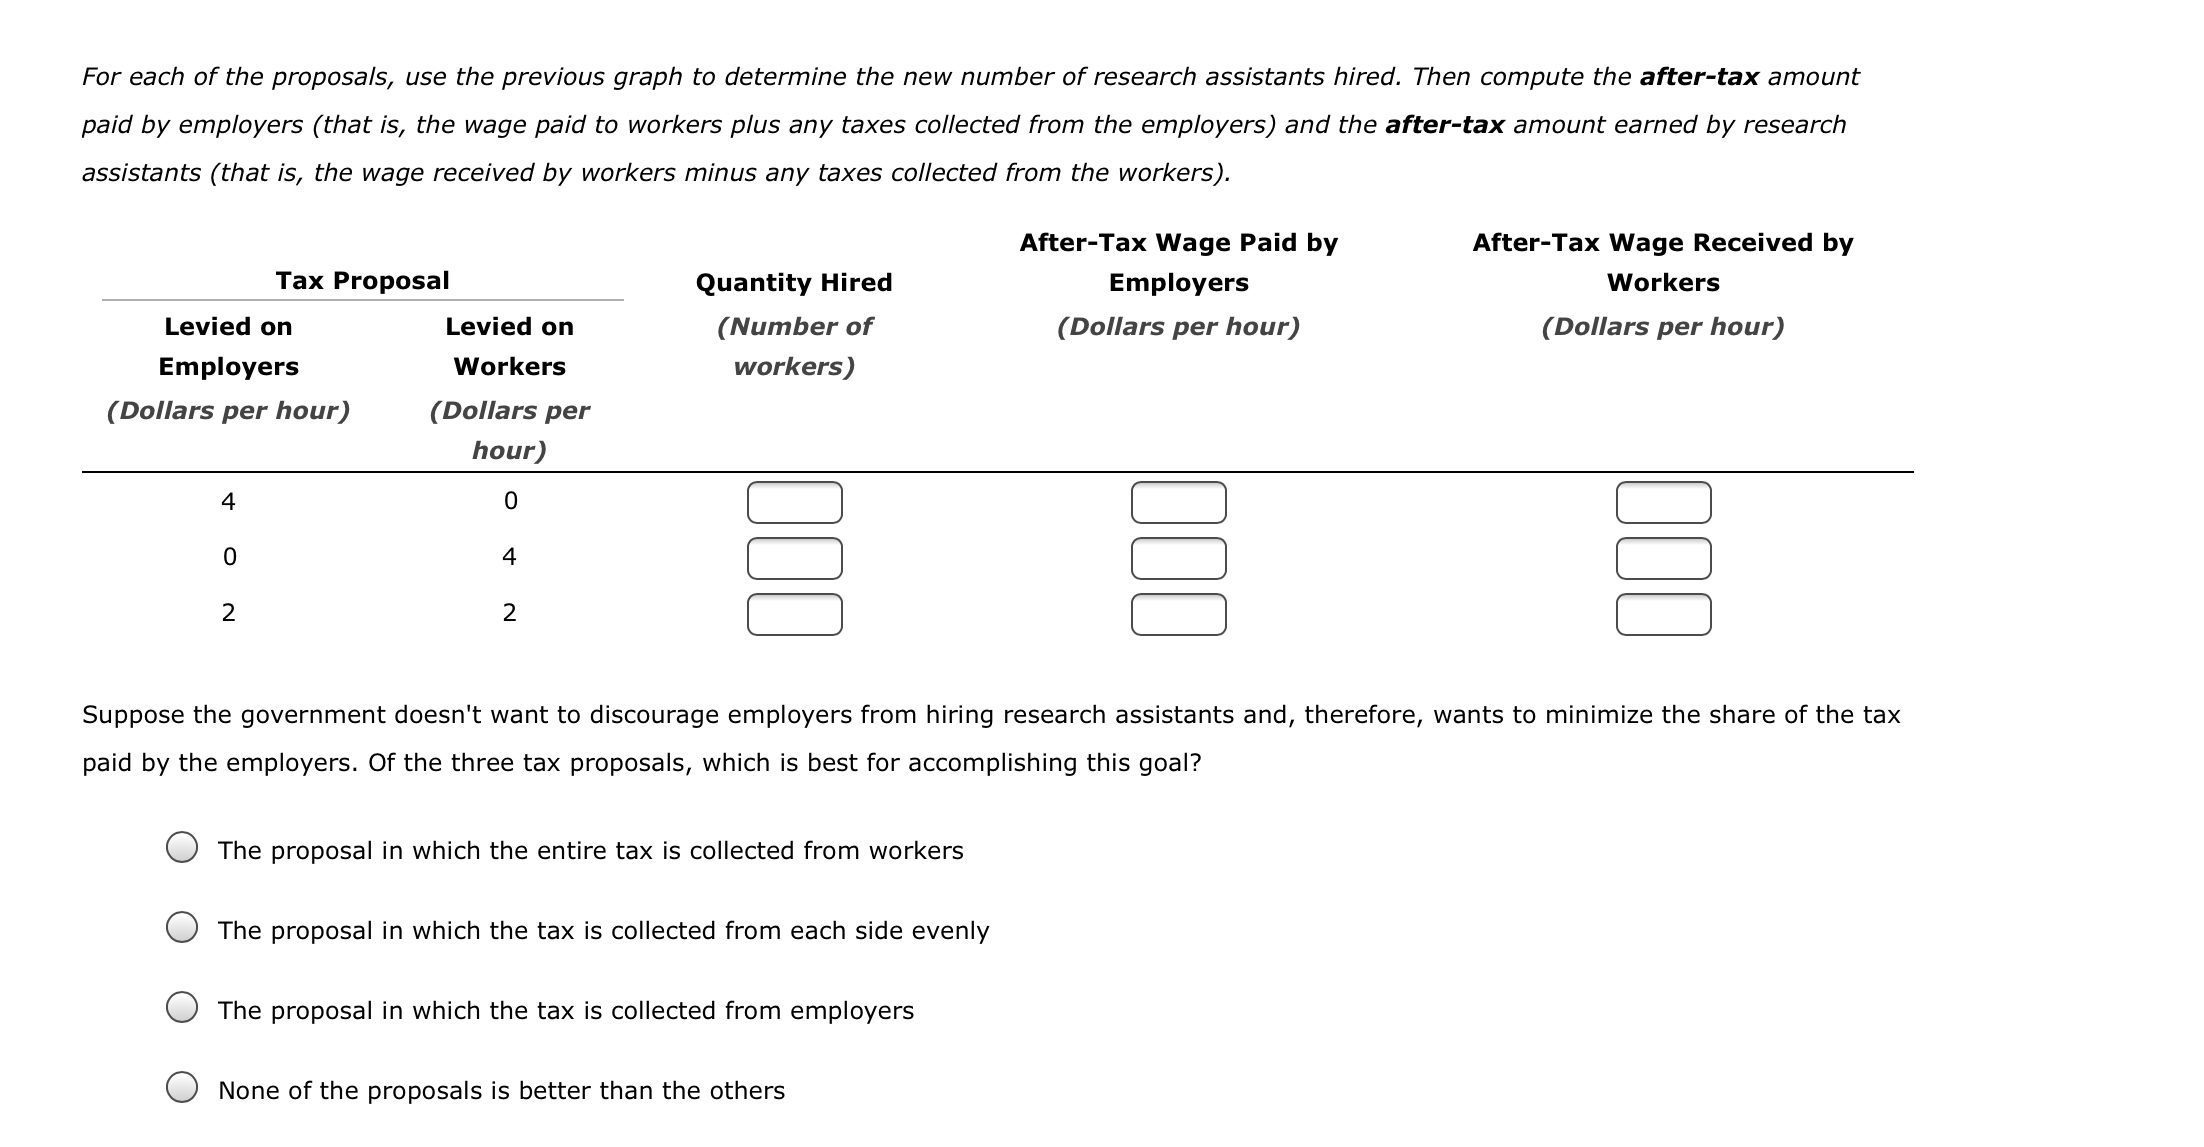
6. Who should pay the tax? The following graph shows the labor market for research assistants in the fictional countw of Academia. The equilibrium wage is $10 per hour, and the equilibrium number of research assistants is 100. Suppose the government has decided to institute a $4-per-hour payroll tax on research assistants and is trying to determine whether the tax should be levied on the employer, the workers, or both (such that half the tax is collected from each side). Use the graph input tool to evaluate these three proposals. Entering a number into the Tax Levied on Employers eld (initially set at zero dollars per hour) shifts the demand curve down by the amount you enter, and entering a number into the Tax Levied on Workers eld (initially set at zero dollars per hour) shifts the supply curve up by the amount you enter. To determine the before-tax wage for each tax proposal, adjust the amount in the Wage eld until the quantity of labor supplied equals the quantity of labor demanded. You will not be graded on any changes you make to this graph. Note: Once you enter a value in a white field, the graph and any corresponding amounts in each grey field will change accordingly. Graph Input Tool 20 Market for Research Assistants 18 Wage 4 16 (Dollars per hour) WAGE (Dollars per hour) Supply Labor Demanded (Number of workers) 250 Labor Supplied 14 (Number of workers) 0 12 10 Demand Shifter Supply Shifter Demand Tax Levied on Tax Levied on Employers 0 0 (Dollars per hour) Workers (Dollars per hour) A N 0 20 40 60 80 100 120 140 160 180 200 LABOR (Number of workers)For each of the proposals, use the previous graph to determine the new number of research assistants hired. Then compute the after-tax amount paid by employers (that is, the wage paid to workers plus any taxes collected from the employers) and the after-tax amount earned by research assistants (that is, the wage received by workers minus any taxes collected from the workers). After-Tax Wage Paid by After-Tax Wage Received by Tax Proposal Quantity Hired Employers Workers Levied on Levied on (Number of (Dollars per hour) (Dollars per hour) Employers Workers workers) (Dollars per hour) (Dollars per hour) 4 0 [:1 [:1 [:1 o 4 [:1 [:1 [:1 2 2 [:1 [:1 [:1 Suppose the government doesn't want to discourage employers from hiring research assistants and, therefore, wants to minimize the share of the tax paid by the employers. Of the three tax proposals, which is best for accomplishing this goal? 0 The proposal in which the entire tax is collected from workers 0 The proposal in which the tax is collected from each side evenly O The proposal in which the tax is collected from employers 0 None of the proposals is better than the others


