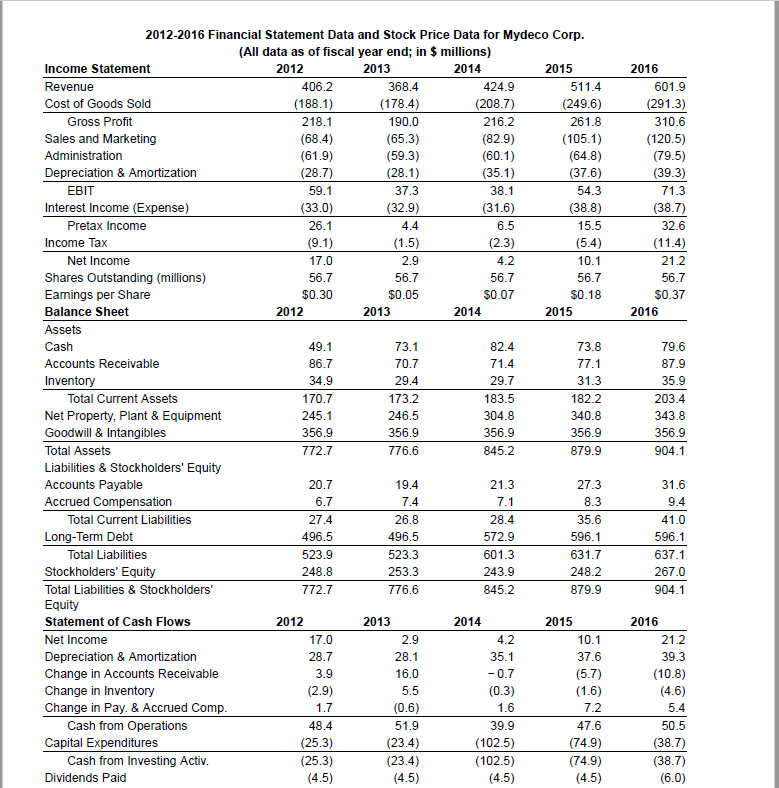
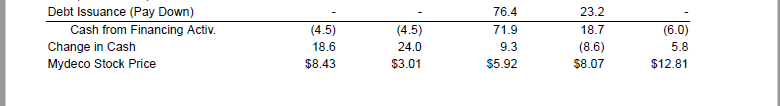
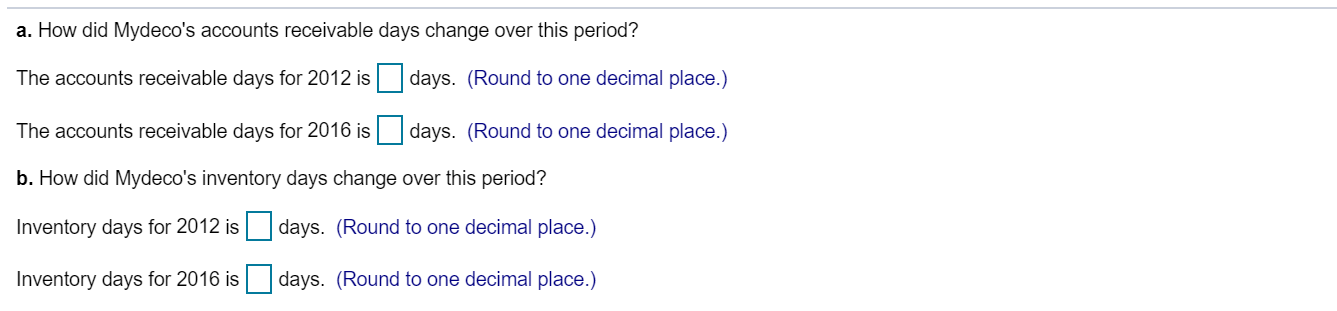

601.9 216.2 (291.3) 310.6 (120.5) (79.5) (39.3) 71.3 (38.7) 32.6 (11.4) 21.2 56.7 $0.37 2016 4.2 56.7 2014 79.6 87.9 35.9 2012-2016 Financial Statement Data and Stock Price Data for Mydeco Corp. (All data as of fiscal year end; in $ millions) Income Statement 2012 Revenue 406.2 368.4 424. 9 511.4 Cost of Goods Sold (188.1) (178.4) (208.7) (249.6) Gross Profit 218.1 190.0 261.8 Sales and Marketing (68.4) (65.3) (82.9) (105.1) Administration (61.9) (59.3) (60.1) (64.8) Depreciation & Amortization (28.7) (28.1) (35.1) (37.6) EBIT 59.1 37.3 38.1 54.3 Interest Income (Expense) (33.0) (32.9) (31.6) (38.8) Pretax Income 26.1 4.4 6.5 15.5 Income Tax (9.1) (1.5) (2.3) (5.4) Net Income 17.0 2.9 10.1 Shares Outstanding (millions) 56.7 56.7 56.7 Earnings per Share $0.30 $0.05 $0.07 $0.18 Balance Sheet 2012 2013 2015 Assets Cash 49.1 73.1 82.4 73.8 Accounts Receivable 86.7 70.7 71.4 77.1 Inventory 34.9 29.4 29.7 31.3 Total Current Assets 170.7 173.2 183.5 182.2 Net Property, Plant & Equipment 245.1 246.5 304.8 340.8 Goodwill & Intangibles 356.9 356.9 356.9 356.9 Total Assets 772.7 776.6 845.2 879.9 Liabilities & Stockholders' Equity Accounts Payable 19.4 21.3 27.3 Accrued Compensation 7.4 7.1 8.3 Total Current Liabilities 27.4 26.8 28.4 35.6 Long-Term Debt 496.5 496.5 572.9 596.1 Total Liabilities 523.9 601.3 631.7 Stockholders' Equity 248.8 253.3 243.9 248.2 Total Liabilities & Stockholders' 772.7 776.6 845.2 879.9 Equity Statement of Cash Flows 2012 2013 2014 2015 Net Income 17.0 2.9 4.2 10.1 Depreciation & Amortization 28.7 28.1 35.1 37.6 Change in Accounts Receivable 16.0 -0.7 (5.7) Change in Inventory (2.9) 5.5 (0.3) (1.6) Change in Pay. & Accrued Comp. (0.6) 1.6 Cash from Operations 48.4 51.9 39.9 47.6 Capital Expenditures (25.3) (23.4) (102.5) (74.9) Cash from Investing Activ. (25.3) (23.4) (102.5) (74.9) Dividends Paid (4.5) (4.5) (4.5) (4.5) 203.4 339333333333333333333 ****8233 343.8 356.9 904.1 20.7 6.7 31.6 9.4 41.0 596.1 523.3 637.1 267.0 904.1 2016 21.2 3.9 1.7 7.2 39.3 (10.8) (4.6) 5.4 50.5 (38.7) (38.7) (6.0) Debt Issuance (Pay Down) Cash from Financing Activ. Change in Cash Mydeco Stock Price (6.0) (4.5) 18.6 $8.43 (4.5) 24.0 $3.01 76.4 71.9 9.3 $5.92 23.2 18.7 (8.6) $8.07 5.8 $12.81 a. How did Mydeco's accounts receivable days change over this period? The accounts receivable days for 20 /s. (Round to one decimal place.) The accounts receivable days for 2 S. (Round to one decimal place.) b. How did Mydeco's inventory days change over this period? Inventory days for 2012 is . (Round to one decimal place.) Inventory days for 2016 is days. (Round to one decimal place.) c. Based on your analysis, has Mydeco improved its management of its working capital during this time period? (Select the best choice below.) Between 2012 and 2016, Mydeco's working capital management was by both accounts receivable days and inventory days