Answered step by step
Verified Expert Solution
Link Copied!

Question

1 Approved Answer

602 A A N 60.00 a. Use the data to calculate annual rates of return for Bartman, Reynolds, and the Winslow 50oo Index. Then calculate

image text in transcribed
602 A A N 60.00 a. Use the data to calculate annual rates of return for Bartman, Reynolds, and the Winslow 50oo Index. Then calculate each entity's average return over the 5-year period. (Hint: Remember, returns are calculated by subtracting the beginning price from the ending price to get the capital gain or loss, adding the dividend to the capital gain or loss, and dividing the result by the beginning price. Assume that dividends are already included in the index. Also, you cannot calculate the rate of return for 2009 because you do not have 2008 data.) b. Calculate the standard deviations of the returns for Bartman, Reynolds, and the Winslow sooo. (Hint: Use the sample standard deviation formula, Equation 8.2a in this chapter, which corresponds to the STDEV function in Excel.) c. Calculate the coefficients of variation for Bartman, Reynolds, and the Winslow 5000 d. Construct a scatter diagram that shows Bartman's and Reynolds's returns on the vertical axis and the Winslow 5000 Index's returns on the horizontal axis

Step by Step Solution

There are 3 Steps involved in it

Step: 1

blur-text-image

Get Instant Access to Expert-Tailored Solutions

See step-by-step solutions with expert insights and AI powered tools for academic success

Step: 2

blur-text-image

Step: 3

blur-text-image

Ace Your Homework with AI

Get the answers you need in no time with our AI-driven, step-by-step assistance

Get Started

Recommended Textbook for

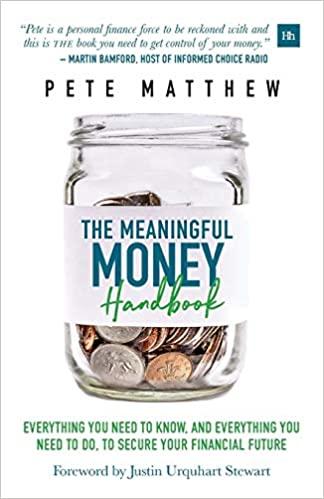
The Meaningful Money Handbook

Authors: Pete Matthew

1st Edition

0857196510, 978-0857196514

More Books

Students also viewed these Finance questions