

Answered step by step
Verified Expert Solution
Question
1 Approved Answer
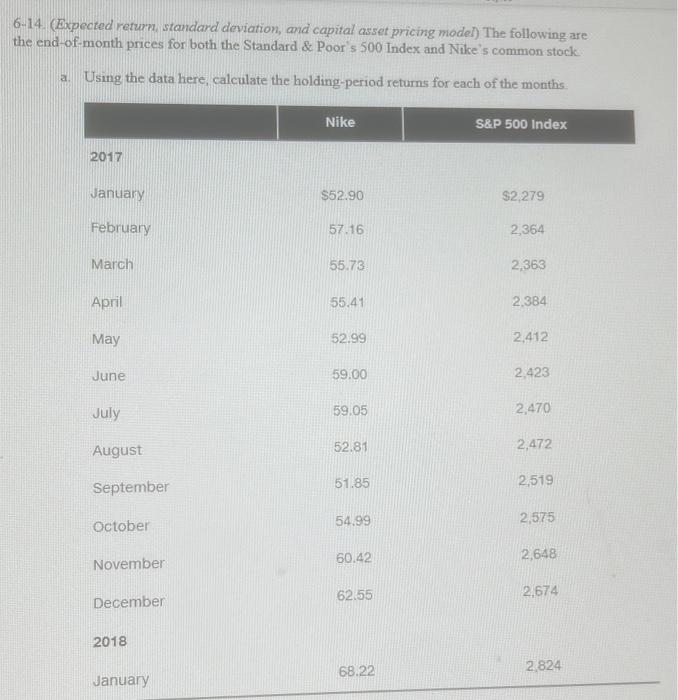
6-14. (Expected return, standard deviation, and capital asset pricing model) The following are the end-of-month prices for both the Standard & Poor's 500 Index and
Step by Step Solution
There are 3 Steps involved in it
Step: 1

Get Instant Access to Expert-Tailored Solutions
See step-by-step solutions with expert insights and AI powered tools for academic success
Step: 2

Step: 3
Ace Your Homework with AI
Get the answers you need in no time with our AI-driven, step-by-step assistance
Get Started
Beyond Greed And Fear Understanding Behavioral Finance And The Psychology Of Investing
Authors: Hersh Shefrin
1st Edition
0195161211, 978-0195161212