

Answered step by step
Verified Expert Solution
Question
1 Approved Answer
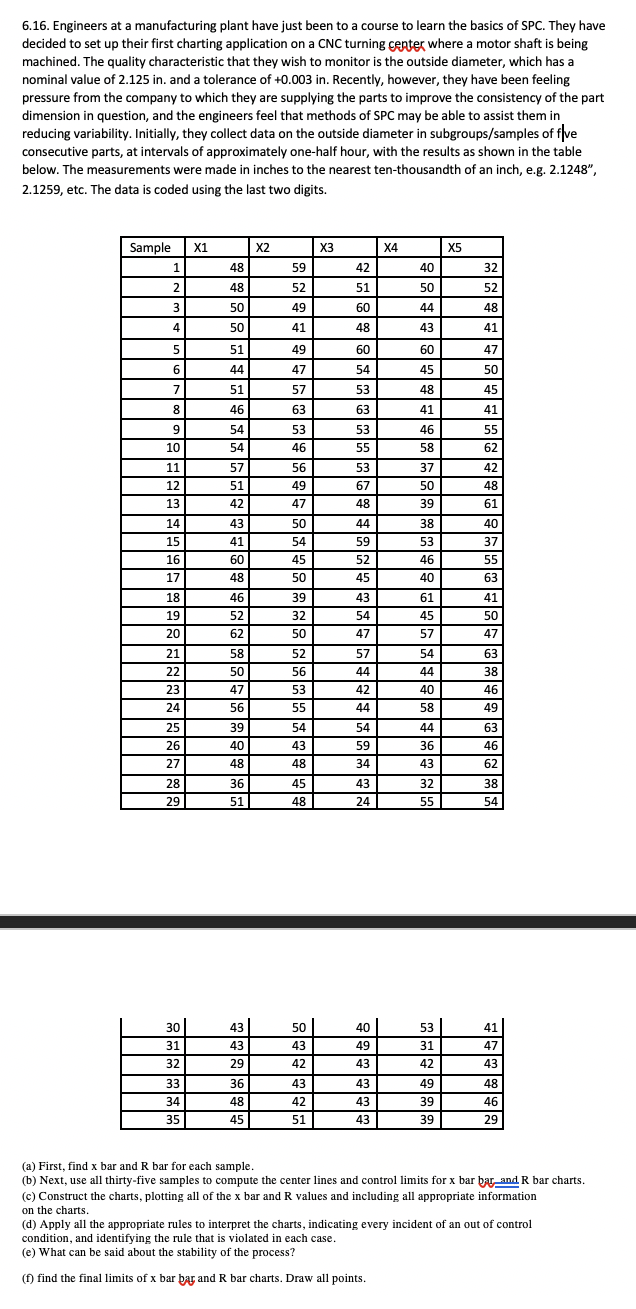
6.16. Engineers at a manufacturing plant have just been to a course to learn the basics of SPC. They have decided to set up their
Step by Step Solution
There are 3 Steps involved in it
Step: 1

Get Instant Access to Expert-Tailored Solutions
See step-by-step solutions with expert insights and AI powered tools for academic success
Step: 2

Step: 3
Ace Your Homework with AI
Get the answers you need in no time with our AI-driven, step-by-step assistance
Get Started
Financial Algebra advanced algebra with financial applications
Authors: Robert K. Gerver
1st edition
978-1285444857, 128544485X, 978-0357229101, 035722910X, 978-0538449670