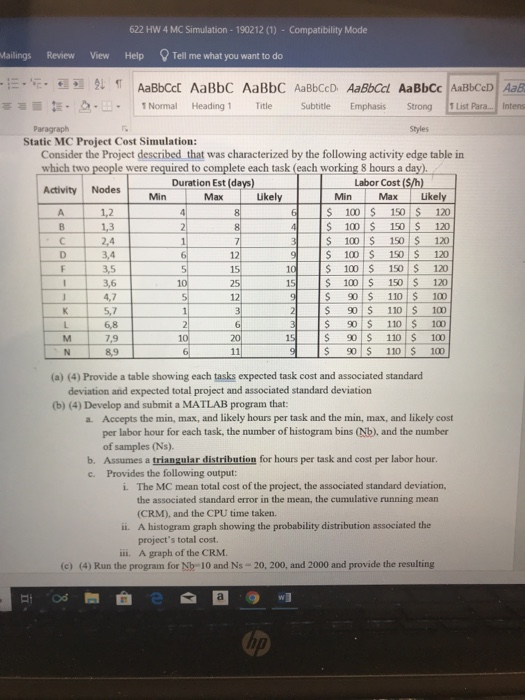
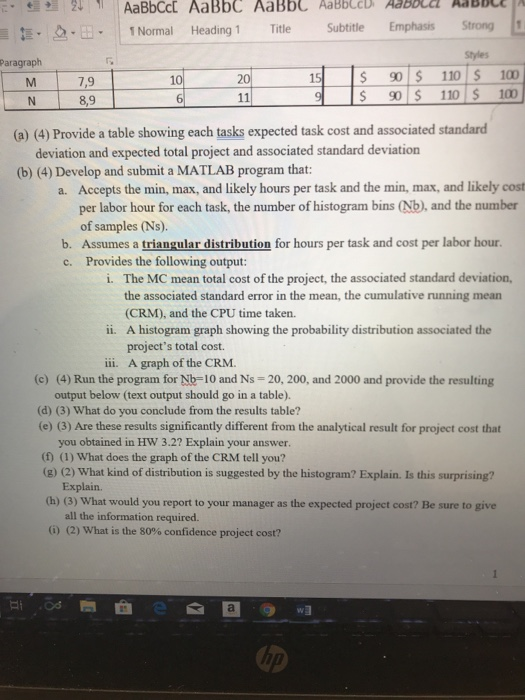
622 Hw 4 MC Simulation-190212 (1) Compatibility Mode Mailings Review View Help Tell me what you want to do AaBbCct AaBbC AaBbC AaBbCcD AaBbCcl AaBbCc AaBbCeD AaB 11 . |1Normal Heading 1 strongmist Para.| Intens Styles Title Subtitle Emphasis Static MC Project Cost Simulation: Consider the Project described that was characterized by the following activity edge table in which two people were required to complete each task (each working 8 hours a day) Duration Est (days) Labor Cost (S/h) Activity Nodes |-Min -- Min Max | ukely Min Max | Likely 6$ 100 150 $ 120 100 150 S 120 S 100 150 120 $100 150120 10S 100 150 S 120 100 150 S 120 S 90 110 S 10o 2S 9 S 110 S 100 S 90 S 110 100 $ 90S 110S 100 9 90 110 100 A l 1,2 1,3 24 3,5 3,6 K5,7 B 12 L68 M | 7,9 (a) (4) Provide a table showing each tasks expected task cost and associated standard deviation and expected total project and associated standard deviation (b) (4) Develop and submit a MATLAB program that: Accepts the min, max, and likely hours per task and the min, max, and likely cost per labor hour for each task, the number of histogram bins (Nb), and the number of samples (Ns). Assumes a triangular distribution for hours per task and cost per labor hour. Provides the following output: a. b. c. i. The MC mean total cost of the project, the associated standard deviation, the associated standard error in the mean, the cumulative running mean (CRM), and the CPU time taken. A histogram graph showing the probability distribution associated the project's total cost. ii. ii. A graph of the CRM. (c) (4) Run the program for Nb 10 and Ns-20, 200, and 2000 and provide the resulting .04e @@J 2.11Normal Heading 1 Title Subtitle Emphasis Strong L Styles Paragraph 7,9 8,9 s 90 S 110 S 100 $ 90 $ 110 S 100 (a) (4) Provide a table showing each tasks expected task cost and associated standard deviation and expected total project and associated standard deviation (b) (4) Develop and submit a MATLAB program that a. Accepts the min, max, and likely hours per task and the min, max, and likely cost per labor hour for each task, the number of histogram bins (Nb), and the number of samples (Ns). b. Assumes a triangular distribution for hours per task and cost per labor hour c. Provides the following output: The MC mean total cost of the project, the associated standard deviation, the associated standard error in the mean, the cumulative running mean (CRM), and the CPU time taken. A histogram graph showing the probability distribution associated the project's total cost. A graph of the CRM. i. ii. iii. (c) (4) Run the program for Nb=10 and Ns-20, 200, and 2000 and provide the resulting output below (text output should go in a table). (d) (3) What do you conclude from the results table? (e) (3) Are these results significantly different from the analytical result for project cost that you obtained in HW 3.2? Explain your answer. (0) (1) What does the graph of the CRM tell you? (B) (2) What kind of distribution is suggested by the histogram? Explain. Is this surprising? Explain. (h) (3) What would you report to your manager as the expected project cost? Be sure to give all the information required. (i) (2) what is the 80% confidence project cost? 622 Hw 4 MC Simulation-190212 (1) Compatibility Mode Mailings Review View Help Tell me what you want to do AaBbCct AaBbC AaBbC AaBbCcD AaBbCcl AaBbCc AaBbCeD AaB 11 . |1Normal Heading 1 strongmist Para.| Intens Styles Title Subtitle Emphasis Static MC Project Cost Simulation: Consider the Project described that was characterized by the following activity edge table in which two people were required to complete each task (each working 8 hours a day) Duration Est (days) Labor Cost (S/h) Activity Nodes |-Min -- Min Max | ukely Min Max | Likely 6$ 100 150 $ 120 100 150 S 120 S 100 150 120 $100 150120 10S 100 150 S 120 100 150 S 120 S 90 110 S 10o 2S 9 S 110 S 100 S 90 S 110 100 $ 90S 110S 100 9 90 110 100 A l 1,2 1,3 24 3,5 3,6 K5,7 B 12 L68 M | 7,9 (a) (4) Provide a table showing each tasks expected task cost and associated standard deviation and expected total project and associated standard deviation (b) (4) Develop and submit a MATLAB program that: Accepts the min, max, and likely hours per task and the min, max, and likely cost per labor hour for each task, the number of histogram bins (Nb), and the number of samples (Ns). Assumes a triangular distribution for hours per task and cost per labor hour. Provides the following output: a. b. c. i. The MC mean total cost of the project, the associated standard deviation, the associated standard error in the mean, the cumulative running mean (CRM), and the CPU time taken. A histogram graph showing the probability distribution associated the project's total cost. ii. ii. A graph of the CRM. (c) (4) Run the program for Nb 10 and Ns-20, 200, and 2000 and provide the resulting .04e @@J 2.11Normal Heading 1 Title Subtitle Emphasis Strong L Styles Paragraph 7,9 8,9 s 90 S 110 S 100 $ 90 $ 110 S 100 (a) (4) Provide a table showing each tasks expected task cost and associated standard deviation and expected total project and associated standard deviation (b) (4) Develop and submit a MATLAB program that a. Accepts the min, max, and likely hours per task and the min, max, and likely cost per labor hour for each task, the number of histogram bins (Nb), and the number of samples (Ns). b. Assumes a triangular distribution for hours per task and cost per labor hour c. Provides the following output: The MC mean total cost of the project, the associated standard deviation, the associated standard error in the mean, the cumulative running mean (CRM), and the CPU time taken. A histogram graph showing the probability distribution associated the project's total cost. A graph of the CRM. i. ii. iii. (c) (4) Run the program for Nb=10 and Ns-20, 200, and 2000 and provide the resulting output below (text output should go in a table). (d) (3) What do you conclude from the results table? (e) (3) Are these results significantly different from the analytical result for project cost that you obtained in HW 3.2? Explain your answer. (0) (1) What does the graph of the CRM tell you? (B) (2) What kind of distribution is suggested by the histogram? Explain. Is this surprising? Explain. (h) (3) What would you report to your manager as the expected project cost? Be sure to give all the information required. (i) (2) what is the 80% confidence project cost