

Answered step by step
Verified Expert Solution
Question
1 Approved Answer
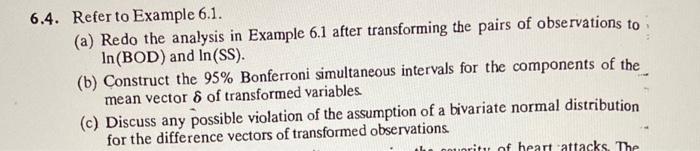
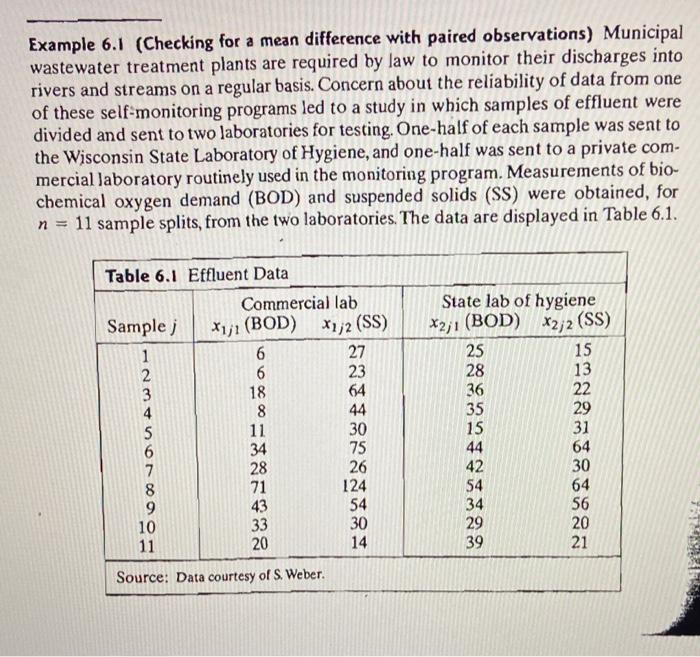
6.4. Refer to Example 6.1. (a) Redo the analysis in Example 6.1 after transforming the pairs of observations to ln(BOD) and ln(SS) (b) Construct the
Step by Step Solution
There are 3 Steps involved in it
Step: 1

Get Instant Access to Expert-Tailored Solutions
See step-by-step solutions with expert insights and AI powered tools for academic success
Step: 2

Step: 3
Ace Your Homework with AI
Get the answers you need in no time with our AI-driven, step-by-step assistance
Get Started
Managerial Accounting 1
Authors: Ray H. Garrison
1st Edition
1259114457, 978-1259114458