Answered step by step
Verified Expert Solution
Question
1 Approved Answer
The management of Digger Inc., is trying to develop a cost formula for its major manufacturing overhead activities. Digger's manufacturing process is highly au-


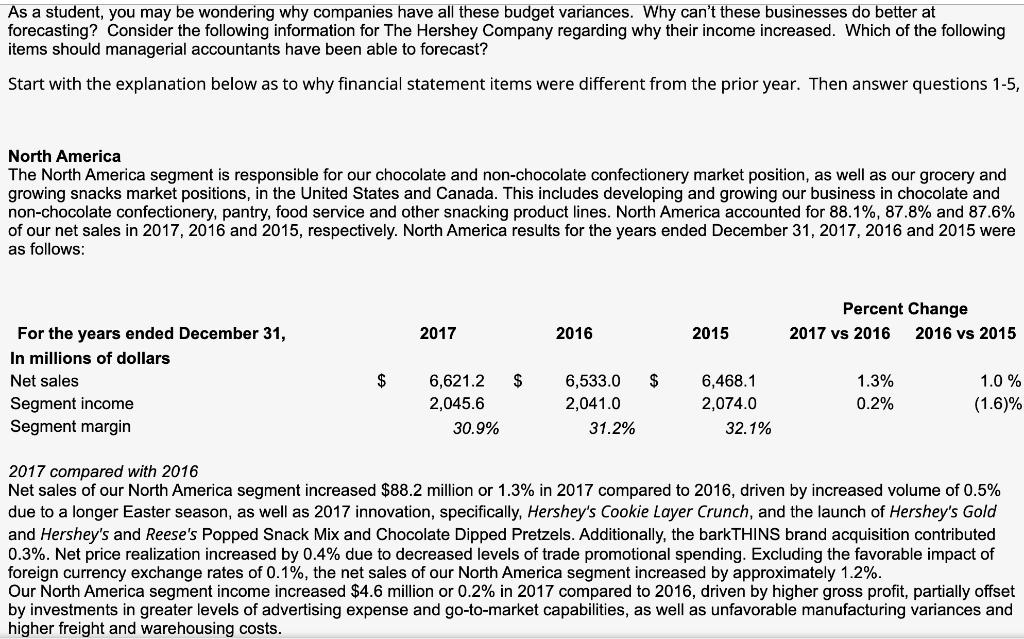
The management of Digger Inc., is trying to develop a cost formula for its major manufacturing overhead activities. Digger's manufacturing process is highly au- tomated and power costs are a significant manufacturing cost. Cost analysts have decided that power costs are mixed. The costs must be separated into their fixed and variable components so that the cost behavior of the power usage activity can be better understood. Analysts have determined that machine hours drive power usage, thus machine hours are the cost driver for power costs. Nine months of data have been collected and are presented in the chart below: Period Machine Hours Power Cost 36,000 $ January February 45,000 60,300 45,000 $ 54,000 $ March 67,500 April 39.600 $ 53,064 May 47,250 37,800 32,400 $ 43,200 $ 2$ June 43,416 54,000 July August September 50,400 $ 67,536 46,800 2$ 58,500 Required a. Use the high and low points to estimate a power cost formula. b. Use the method of least squares in Excel or a similar computer program to estimate a power cost formula. Evaluate R? from requirement b. Are machine hours a good predictor of power costs? . c. Evaluate R from requirement b. Are machine hours a good predictor of power costs? (select one) C since 64% of variability in power costs is explained by machine hours, implies 36% of power costs is driven by some other activity. A common rule of thumb is that a "good" independent variable should explain approximately 80% of the variability of a dependent variable. C since 36% of variability in power costs is explained by machine hours, implies 64% of power costs is driven by some other activity. A common rule of thumb is that a "good" independent variable should explain approximately 80% of the variability of a dependent variable. since 95% of variability in power costs is explained by machine hours, implies 5% of power costs is driven by some other activity. A common rule of thumb is that a "good" independent variable should explain approximately 80% of the variability of a dependent variable. since 5% of variability in power costs is explained by machine hours, implies 95% of power costs is driven by some other activity. A common rule of thumb is that a "good" independent variable should explain approximately 80% of the variability of a dependent variable. d. Using the cost formula from requirement b, estimate power costs when 55,800 machine hours are used. Cost Formula: Estimate of power costs: As a student, you may be wondering why companies have all these budget variances. Why can't these businesses do better at forecasting? Consider the following information for The Hershey Company regarding why their income increased. Which of the following items should managerial accountants have been able to forecast? Start with the explanation below as to why financial statement items were different from the prior year. Then answer questions 1-5, North America The North America segment is responsible for our chocolate and non-chocolate confectionery market position, as well as our grocery and growing snacks market positions, in the United States and Canada. This includes developing and growing our business in chocolate and non-chocolate confectionery, pantry, food service and other snacking product lines. North America accounted for 88.1%, 87.8% and 87.6% of our net sales in 2017, 2016 and 2015, respectively. North America results for the years ended December 31, 2017, 2016 and 2015 were as follows: Percent Change For the years ended December 31, In millions of dollars 2017 2016 2015 2017 vs 2016 2016 vs 2015 Net sales $ 6,621.2 $ 6,533.0 $ 6,468.1 1.3% 1.0 % Segment income 2,045.6 2,041.0 2,074.0 0.2% (1.6)% Segment margin 30.9% 31.2% 32.1% 2017 compared with 2016 Net sales of our North America segment increased $88.2 million or 1.3% in 2017 compared to 2016, driven by increased volume of 0.5% due to a longer Easter season, as well as 2017 innovation, specifically, Hershey's Cookie Layer Crunch, and the launch of Hershey's Gold and Hershey's and Reese's Popped Snack Mix and Chocolate Dipped Pretzels. Additionally, the barkTHINS brand acquisition contributed 0.3%. Net price realization increased by 0.4% due to decreased levels of trade promotional spending. Excluding the favorable impact of foreign currency exchange rates of 0.1%, the net sales of our North America segment increased by approximately 1.2%. Our North America segment income increased $4.6 million or 0.2% in 2017 compared to 2016, driven by higher gross profit, partially offset by investments in greater levels of advertising expense and go-to-market capabilities, as well as unfavorable manufacturing variances and higher freight and warehousing costs. Hershey accountants should have included higher freight and warehousing costs in its budget. a. True. FedEx and UPS will contact Hershey to let them know they are thinking about increasing their rates in the coming year so Hershey can budget for the change. b. True. Accountants should always assume that costs will increase and make up a number in the budget. c. True. Accountants should purchase Forever stamps from the post office so shipping costs will not increase ever. d. False. If FedEx or UPS decide to increase their rates, how would Hershey's accounts be able to forecast this?
Step by Step Solution
★★★★★
3.64 Rating (177 Votes )
There are 3 Steps involved in it
Step: 1
C D 1 Period Machine hours Power costs 2 Jan...
Get Instant Access to Expert-Tailored Solutions
See step-by-step solutions with expert insights and AI powered tools for academic success
Step: 2

Step: 3

Ace Your Homework with AI
Get the answers you need in no time with our AI-driven, step-by-step assistance
Get Started


