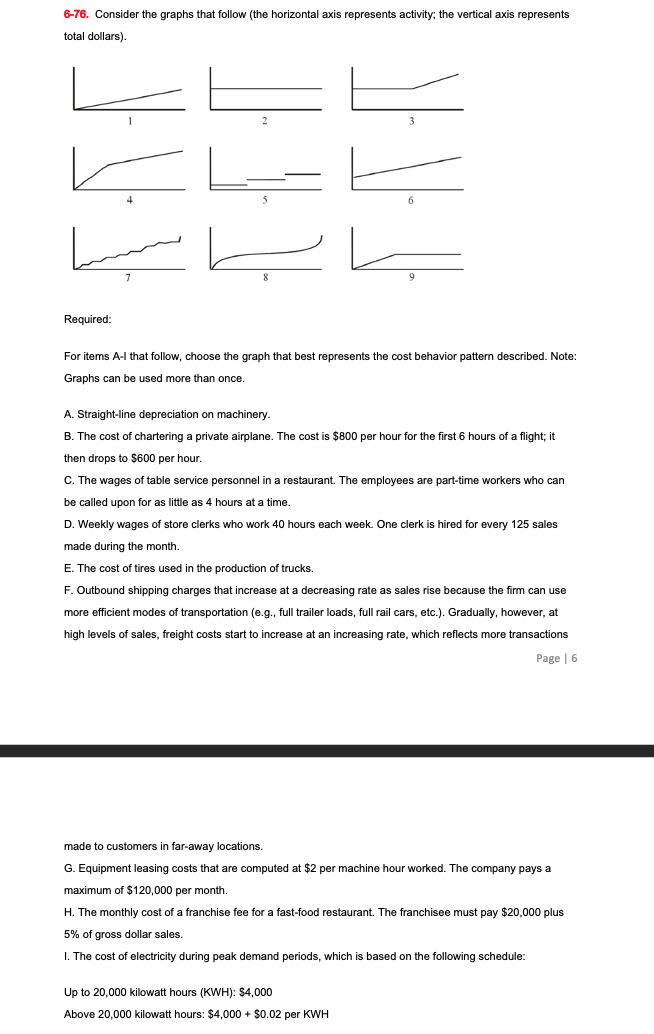
6-76. Consider the graphs that follow (the horizontal axis represents activity; the vertical axis represents total dollars) Required: For items A-I that follow, choose the graph that best represents the cost behavior pattern described. Note: Graphs can be used more than once. A. Straight-line depreciation on machinery B. The cost of chartering a private airplane. The cost is $800 per hour for the first 6 hours of a flight; it then drops to $600 per hour. C. The wages of table service personnel in a restaurant. The employees are part-time workers who can be called upon for as little as 4 hours at a time. D. Weekly wages of store clerks who work 40 hours each week. One clerk is hired for every 125 sales made during the month. E. The cost of tires used in the production of trucks. F. Outbound shipping charges that increase at a decreasing rate as sales rise because the firm can use more efficient modes of transportation (e.g., full trailer loads, full rail cars, etc.). Gradually, however, at high levels of sales, freight costs start to increase at an increasing rate, which reflects more transactions Page 6 made to customers in far-away locations. G. Equipment leasing costs that are computed at $2 per machine hour worked. The company pays a maximum of $120,000 per month. H. The monthly cost of a franchise fee for a fast-food restaurant. The franchisee must pay $20,000 plus 5% of gross dollar sales. 1. The cost of electricity during peak demand periods, which is based on the following schedule: Up to 20,000 kilowatt hours (KWH): $4,000 Above 20,000 kilowatt hours: $4,000 + $0.02 per KWH 6-76. Consider the graphs that follow (the horizontal axis represents activity; the vertical axis represents total dollars) Required: For items A-I that follow, choose the graph that best represents the cost behavior pattern described. Note: Graphs can be used more than once. A. Straight-line depreciation on machinery B. The cost of chartering a private airplane. The cost is $800 per hour for the first 6 hours of a flight; it then drops to $600 per hour. C. The wages of table service personnel in a restaurant. The employees are part-time workers who can be called upon for as little as 4 hours at a time. D. Weekly wages of store clerks who work 40 hours each week. One clerk is hired for every 125 sales made during the month. E. The cost of tires used in the production of trucks. F. Outbound shipping charges that increase at a decreasing rate as sales rise because the firm can use more efficient modes of transportation (e.g., full trailer loads, full rail cars, etc.). Gradually, however, at high levels of sales, freight costs start to increase at an increasing rate, which reflects more transactions Page 6 made to customers in far-away locations. G. Equipment leasing costs that are computed at $2 per machine hour worked. The company pays a maximum of $120,000 per month. H. The monthly cost of a franchise fee for a fast-food restaurant. The franchisee must pay $20,000 plus 5% of gross dollar sales. 1. The cost of electricity during peak demand periods, which is based on the following schedule: Up to 20,000 kilowatt hours (KWH): $4,000 Above 20,000 kilowatt hours: $4,000 + $0.02 per KWH