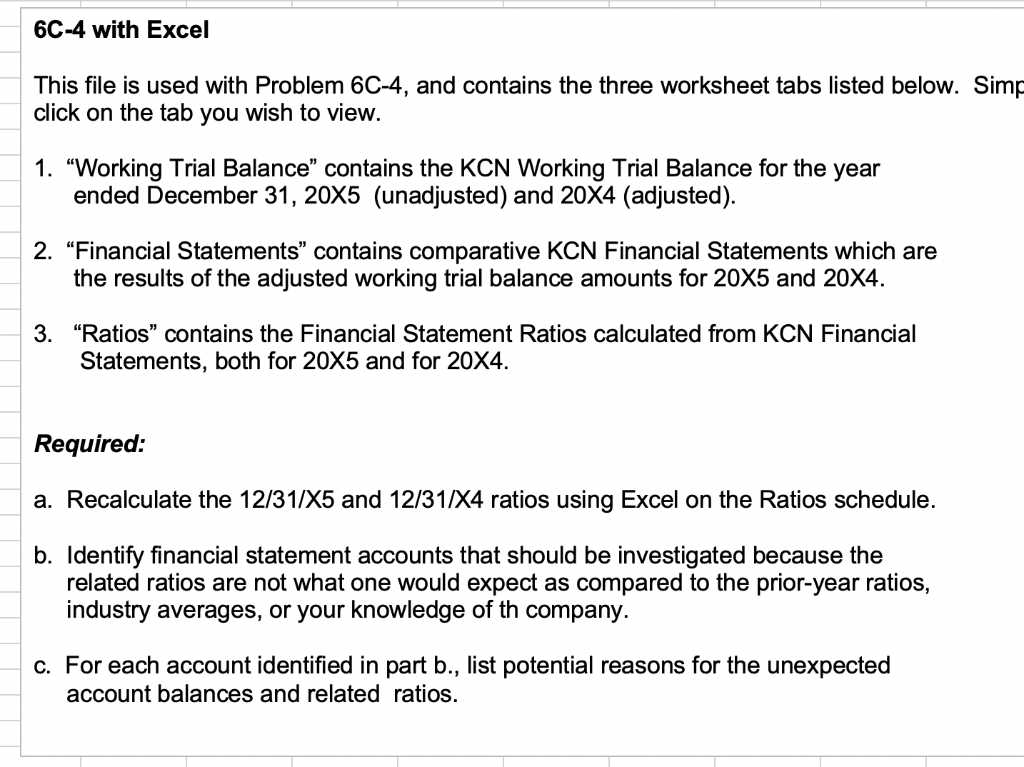
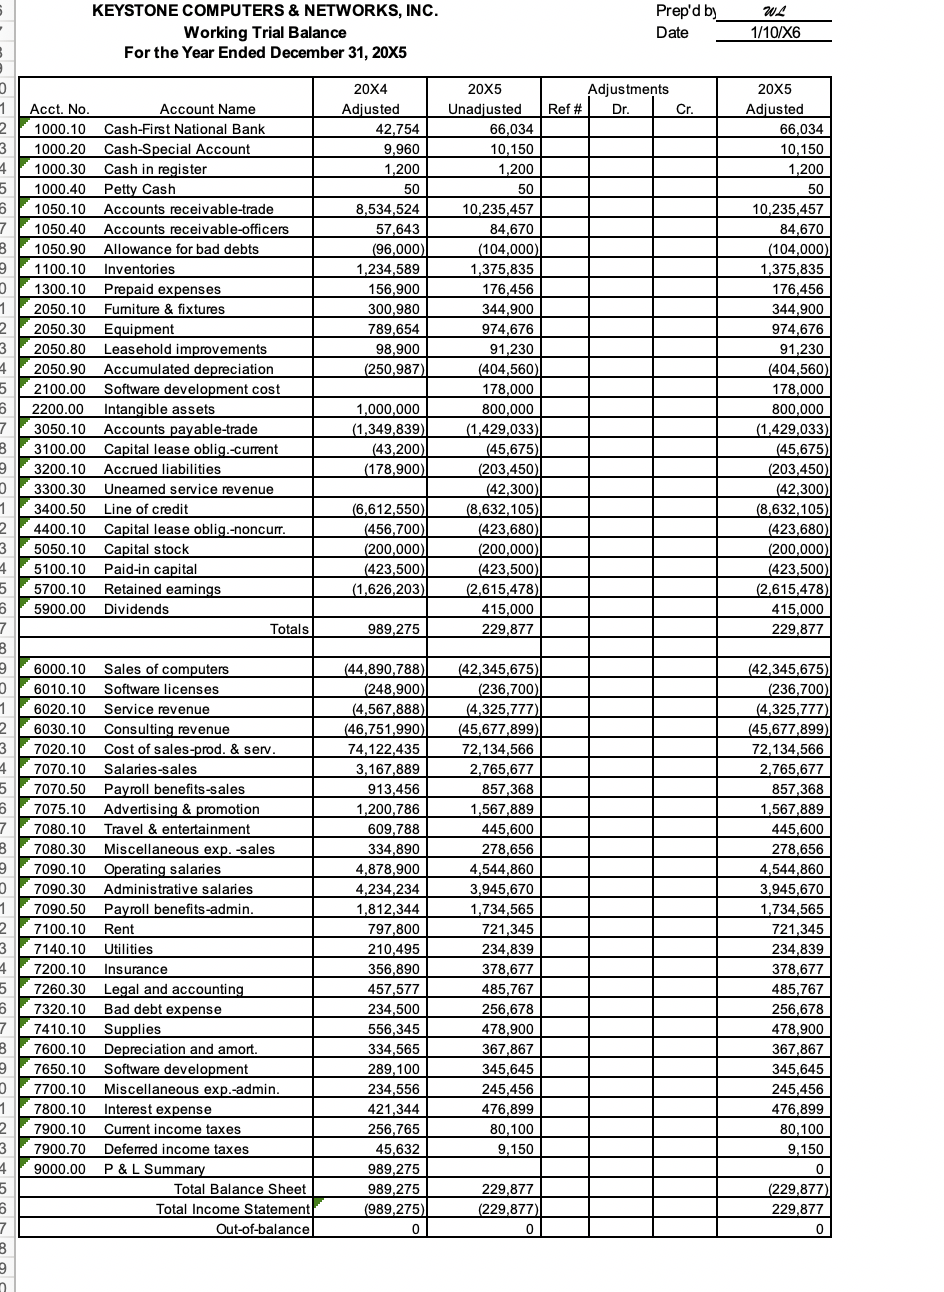
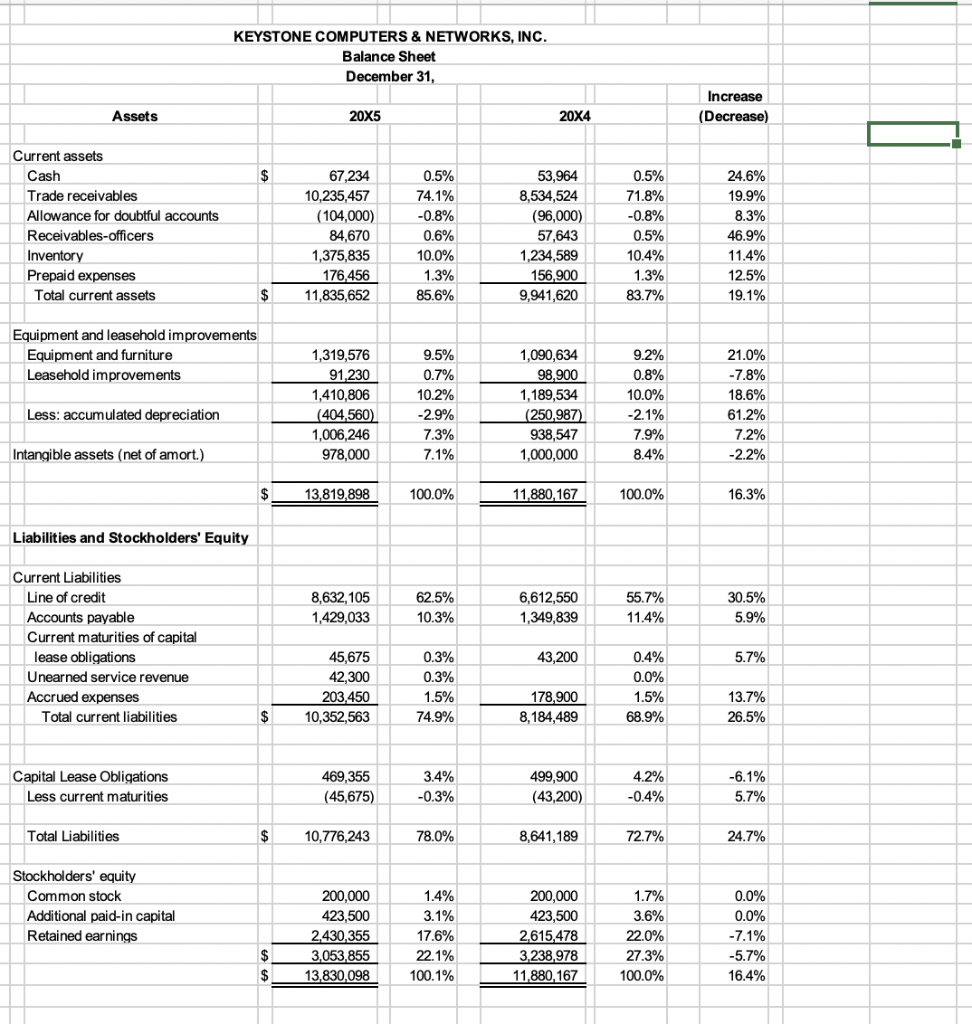
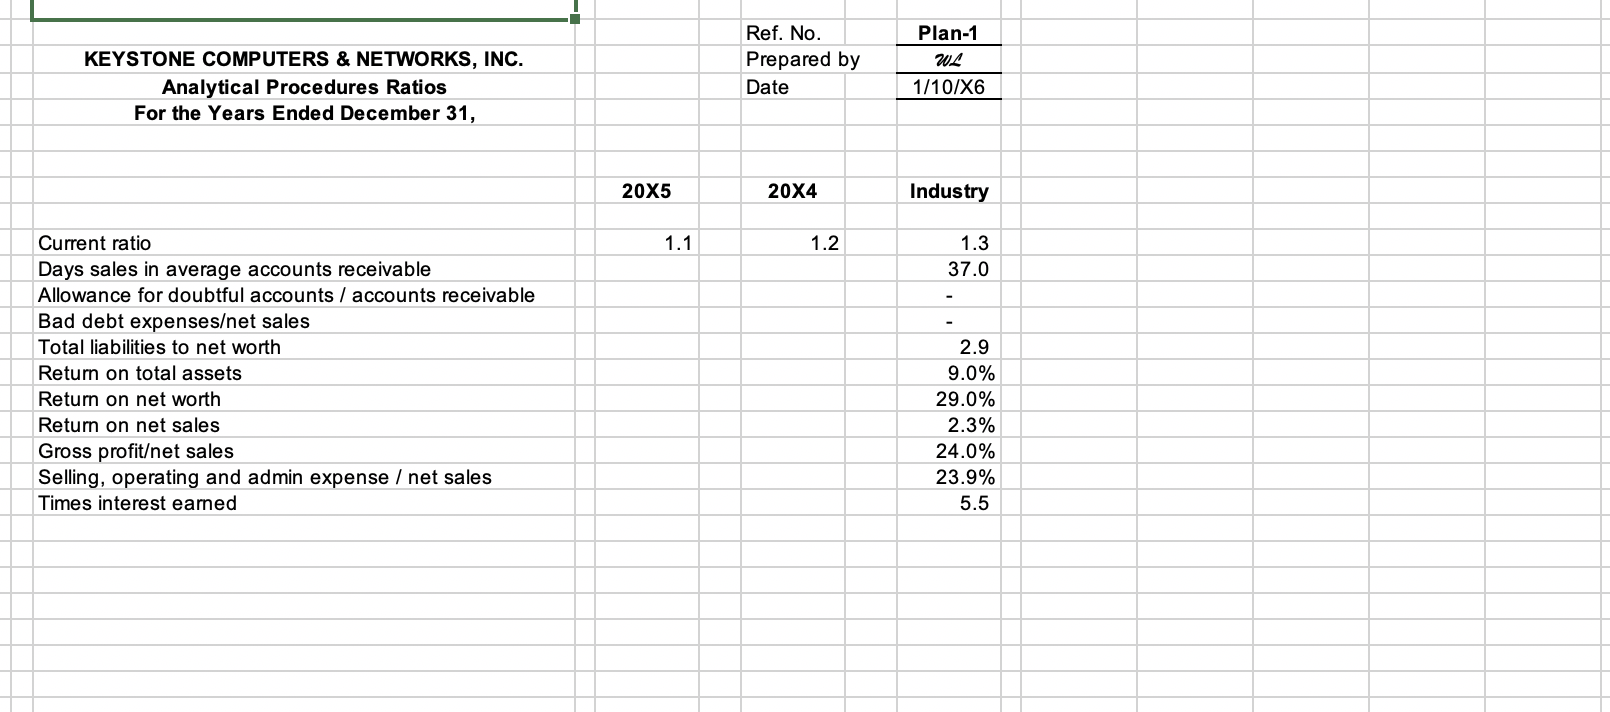
6C-4 with Excel This file is used with Problem 6C-4, and contains the three worksheet tabs listed below. Simp click on the tab you wish to view. 1. Working Trial Balance contains the KCN Working Trial Balance for the year ended December 31, 20X5 (unadjusted) and 20X4 (adjusted). 2. Financial Statements contains comparative KCN Financial Statements which are the results of the adjusted working trial balance amounts for 20X5 and 20X4. 3. "Ratios" contains the Financial Statement Ratios calculated from KCN Financial Statements, both for 20X5 and for 20X4. Required: b. Identify financial statement accounts that should be investigated because the related ratios are not what one would expect as compared to the prior-year ratios, industry averages, or your knowledge of th company. c. For each account identified in part b., list potential reasons for the unexpected account balances and related ratios. KEYSTONE COMPUTERS & NETWORKS, INC. Working Trial Balance For the Year Ended December 31, 20X5 Prep'd by Date w 1/10/X6 Adjustments Ref # Dr. Cr. 20X5 Unadjusted 66,034 10,150 1,200 20X5 Adjusted 66,034 10,150 1,200 50 NtaN Acct. No. 1000.10 1000.20 1000.30 1000.40 1050.10 1050.40 1050.90 1100.10 1300.10 2050.10 2050.30 2050.80 2050.90 2100.00 2200.00 3050.10 3100.00 3200.10 3300.30 3400.50 4400.10 5050.10 5100.10 5700.10 5900.00 Account Name Cash-First National Bank Cash-Special Account Cash in register Petty Cash Accounts receivable-trade Accounts receivable-officers Allowance for bad debts Inventories Prepaid expenses Furniture & fixtures Equipment Leasehold improvements Accumulated depreciation Software development cost Intangible assets Accounts payable-trade Capital lease oblig.-current Accrued liabilities Uneared service revenue Line of credit Capital lease oblig.-noncurr. Capital stock Paid-in capital Retained earnings Dividends Totals 20X4 Adjusted | 42,754 9,960 1,200 50 8,534,524 57,643 (96,000) 1,234,589 156,900 300,980 789,654 98,900 (250,987) sto 1,000,000 (1,349,839) (43,200) (178,900 10,235,457 84,670 (104,000) 1,375,835 176,456 344,900 974,676 91,230 (404,560) 178,000 800,000 (1,429,033) (45,675) (203,450) (42,300) (8,632,105) (423,680) (200,000) (423,500) (2,615,478) 415,000 229,877 50 10,235,457 84,670 (104,000) 1,375,835 176,456 344,900 974,676 91,230 (404,560) 178,000 800,000 (1,429,033) (45,675) (203,450) (42,300) (8,632,105) (423,680) (200,000) (423,500) (2,615,478) 415,000 229,877 (6,612,550)| (456,700) (200,000)| (423,500) (1,626,203 989,275 tot ontston 6000.10 Sales of computers 6010.10 Software licenses 6020.10 Service revenue 6030.10 Consulting revenue 7020.10 Cost of sales-prod. & serv. 7070.10 Salaries-sales 7070.50 Payroll benefits-sales 7075.10 Advertising & promotion 7080.10 Travel & entertainment 7080.30 Miscellaneous exp. -sales 7090.10 Operating salaries 7090.30 Administrative salaries 7090.50 Payroll benefits-admin. 7100.10 Rent 7140.10 Utilities 7200.10 Insurance 7260.30 Legal and accounting 7320.10 Bad debt expense 7410.10 Supplies 7600.10 Depreciation and amort. 7650.10 Software development 7700.10 Miscellaneous exp.-admin. 7800.10 Interest expense 7900.10 Current income taxes 7900.70 Deferred income taxes 9000.00 P & L Summary Total Balance Sheet Total Income Statement Out-of-balance (44,890,788)|| (248,900) (4,567,888) (46,751,990)| 74,122,435 3,167,889 913,456 1,200,786 609,788 334,890 4,878,900 4,234,234 1,812,344 797,800 210,495 356,890 457,577 234,500 556,345 334,565 289,100 234,556 421,344 256,765 45,632 989,275 989,275 (989,275) 0 (42,345,675) (236,700) (4,325,777) (45,677,899) 72,134,566 2,765,677 857,368 1,567,889 445,600 278,656 4,544,860 3,945,670 1,734,565 721,345 234,839 378,677 485,767 256,678 478,900 367,867 345,645 245,456 476,899 80,100 9,150 (42.345.675) (236,700) (4,325,777) (45,677,899) 72,134,566 2,765,677 857,368 1,567,889 445,600 278,656 4,544,860 3,945,670 1,734,565 721,345 234,839 378,677 485,767 256,678 478,900 367,867 345,645 245,456 476,899 80,100 9,150 229,877 (229,877) (229,877) 229,877 KEYSTONE COMPUTERS & NETWORKS, INC. Balance Sheet December 31, Increase (Decrease) Assets 20X5 20X4 Current assets Cash Trade receivables Allowance for doubtful accounts Receivables-officers Inventory Prepaid expenses Total current assets 67,234 10,235,457 (104,000) 84,670 1,375,835 176,456 11,835,652 0.5% 74.1% -0.8% 0.6% 10.0% 1.3% 85.6% 53,964 8,534,524 (96,000) 57,643 1,234,589 156,900 9,941,620 0.5% 71.8% -0.8% 0.5% 10.4% 1.3% 83.7% 24.6% 19.9% 8.3% 46.9% 11.4% 12.5% 19.1% Equipment and leasehold improvements Equipment and furniture Leasehold improvements 1,319,576 91,230 1,410,806 (404,560) 1,006,246 978,000 9.5% 0.7% 10.2% -2.9% 7.3% 7.1% 1,090,634 98,900 1,189,534 (250,987) 938,547 1,000,000 9.2% 0.8% 10.0% -2.1% 7.9% 8.4% 21.0% -7.8% 18.6% 61.2% 7.2% -2.2% Less: accumulated depreciation Intangible assets (net of amort.) $ 13,819,898 100.0% 11,880, 167 100.0% 16.3% Liabilities and Stockholders' Equity 8,632,105 1,429,033 62.5% 10.3% 6,612,550 1,349,839 55.7% 11.4% 30.5% 5.9% Current Liabilities Line of credit Accounts payable Current maturities of capital lease obligations Unearned service revenue Accrued expenses Total current liabilities 43,200 5.7% 45,675 42,300 203,450 10,352,563 0.3% 0.3% 1.5% 74.9% 0.4% 0.0% 1.5% 68.9% 178,900 8,184,489 13.7% 26.5% $ Capital Lease Obligations Less current maturities 469,355 (45,675) 3.4% -0.3% 499,900 (43,200) 4.2% -0.4% -6.1% 5.7% Total Liabilities 10,776,243 78.0% 8,641,189 72.7% 24.7% 1.7% Stockholders' equity Common stock Additional paid-in capital Retained earnings 200,000 423,500 2.430,355 3,053,855 13,830,098 1.4% 3.1% 17.6% 22.1% 100.1% 200,000 423,500 2,615,478 3,238,978 11,880,167 3.6% 22.0% 27.3% 100.0% 0.0% 0.0% -7.1% -5.7% 16.4% Plan-1 Ref. No. Prepared by Date KEYSTONE COMPUTERS & NETWORKS, INC. Analytical Procedures Ratios For the Years Ended December 31, WL 1/10/X6 20X5 20X4 Industry 1.1 1.2 1.3 37.0 Current ratio Days sales in average accounts receivable Allowance for doubtful accounts / accounts receivable Bad debt expenseset sales Total liabilities to net worth Return on total assets Return on net worth Return on net sales Gross profitet sales Selling, operating and admin expense / net sales Times interest earned 2.9 9.0% 29.0% 2.3% 24.0% 23.9% 5.5 6C-4 with Excel This file is used with Problem 6C-4, and contains the three worksheet tabs listed below. Simp click on the tab you wish to view. 1. Working Trial Balance contains the KCN Working Trial Balance for the year ended December 31, 20X5 (unadjusted) and 20X4 (adjusted). 2. Financial Statements contains comparative KCN Financial Statements which are the results of the adjusted working trial balance amounts for 20X5 and 20X4. 3. "Ratios" contains the Financial Statement Ratios calculated from KCN Financial Statements, both for 20X5 and for 20X4. Required: b. Identify financial statement accounts that should be investigated because the related ratios are not what one would expect as compared to the prior-year ratios, industry averages, or your knowledge of th company. c. For each account identified in part b., list potential reasons for the unexpected account balances and related ratios. KEYSTONE COMPUTERS & NETWORKS, INC. Working Trial Balance For the Year Ended December 31, 20X5 Prep'd by Date w 1/10/X6 Adjustments Ref # Dr. Cr. 20X5 Unadjusted 66,034 10,150 1,200 20X5 Adjusted 66,034 10,150 1,200 50 NtaN Acct. No. 1000.10 1000.20 1000.30 1000.40 1050.10 1050.40 1050.90 1100.10 1300.10 2050.10 2050.30 2050.80 2050.90 2100.00 2200.00 3050.10 3100.00 3200.10 3300.30 3400.50 4400.10 5050.10 5100.10 5700.10 5900.00 Account Name Cash-First National Bank Cash-Special Account Cash in register Petty Cash Accounts receivable-trade Accounts receivable-officers Allowance for bad debts Inventories Prepaid expenses Furniture & fixtures Equipment Leasehold improvements Accumulated depreciation Software development cost Intangible assets Accounts payable-trade Capital lease oblig.-current Accrued liabilities Uneared service revenue Line of credit Capital lease oblig.-noncurr. Capital stock Paid-in capital Retained earnings Dividends Totals 20X4 Adjusted | 42,754 9,960 1,200 50 8,534,524 57,643 (96,000) 1,234,589 156,900 300,980 789,654 98,900 (250,987) sto 1,000,000 (1,349,839) (43,200) (178,900 10,235,457 84,670 (104,000) 1,375,835 176,456 344,900 974,676 91,230 (404,560) 178,000 800,000 (1,429,033) (45,675) (203,450) (42,300) (8,632,105) (423,680) (200,000) (423,500) (2,615,478) 415,000 229,877 50 10,235,457 84,670 (104,000) 1,375,835 176,456 344,900 974,676 91,230 (404,560) 178,000 800,000 (1,429,033) (45,675) (203,450) (42,300) (8,632,105) (423,680) (200,000) (423,500) (2,615,478) 415,000 229,877 (6,612,550)| (456,700) (200,000)| (423,500) (1,626,203 989,275 tot ontston 6000.10 Sales of computers 6010.10 Software licenses 6020.10 Service revenue 6030.10 Consulting revenue 7020.10 Cost of sales-prod. & serv. 7070.10 Salaries-sales 7070.50 Payroll benefits-sales 7075.10 Advertising & promotion 7080.10 Travel & entertainment 7080.30 Miscellaneous exp. -sales 7090.10 Operating salaries 7090.30 Administrative salaries 7090.50 Payroll benefits-admin. 7100.10 Rent 7140.10 Utilities 7200.10 Insurance 7260.30 Legal and accounting 7320.10 Bad debt expense 7410.10 Supplies 7600.10 Depreciation and amort. 7650.10 Software development 7700.10 Miscellaneous exp.-admin. 7800.10 Interest expense 7900.10 Current income taxes 7900.70 Deferred income taxes 9000.00 P & L Summary Total Balance Sheet Total Income Statement Out-of-balance (44,890,788)|| (248,900) (4,567,888) (46,751,990)| 74,122,435 3,167,889 913,456 1,200,786 609,788 334,890 4,878,900 4,234,234 1,812,344 797,800 210,495 356,890 457,577 234,500 556,345 334,565 289,100 234,556 421,344 256,765 45,632 989,275 989,275 (989,275) 0 (42,345,675) (236,700) (4,325,777) (45,677,899) 72,134,566 2,765,677 857,368 1,567,889 445,600 278,656 4,544,860 3,945,670 1,734,565 721,345 234,839 378,677 485,767 256,678 478,900 367,867 345,645 245,456 476,899 80,100 9,150 (42.345.675) (236,700) (4,325,777) (45,677,899) 72,134,566 2,765,677 857,368 1,567,889 445,600 278,656 4,544,860 3,945,670 1,734,565 721,345 234,839 378,677 485,767 256,678 478,900 367,867 345,645 245,456 476,899 80,100 9,150 229,877 (229,877) (229,877) 229,877 KEYSTONE COMPUTERS & NETWORKS, INC. Balance Sheet December 31, Increase (Decrease) Assets 20X5 20X4 Current assets Cash Trade receivables Allowance for doubtful accounts Receivables-officers Inventory Prepaid expenses Total current assets 67,234 10,235,457 (104,000) 84,670 1,375,835 176,456 11,835,652 0.5% 74.1% -0.8% 0.6% 10.0% 1.3% 85.6% 53,964 8,534,524 (96,000) 57,643 1,234,589 156,900 9,941,620 0.5% 71.8% -0.8% 0.5% 10.4% 1.3% 83.7% 24.6% 19.9% 8.3% 46.9% 11.4% 12.5% 19.1% Equipment and leasehold improvements Equipment and furniture Leasehold improvements 1,319,576 91,230 1,410,806 (404,560) 1,006,246 978,000 9.5% 0.7% 10.2% -2.9% 7.3% 7.1% 1,090,634 98,900 1,189,534 (250,987) 938,547 1,000,000 9.2% 0.8% 10.0% -2.1% 7.9% 8.4% 21.0% -7.8% 18.6% 61.2% 7.2% -2.2% Less: accumulated depreciation Intangible assets (net of amort.) $ 13,819,898 100.0% 11,880, 167 100.0% 16.3% Liabilities and Stockholders' Equity 8,632,105 1,429,033 62.5% 10.3% 6,612,550 1,349,839 55.7% 11.4% 30.5% 5.9% Current Liabilities Line of credit Accounts payable Current maturities of capital lease obligations Unearned service revenue Accrued expenses Total current liabilities 43,200 5.7% 45,675 42,300 203,450 10,352,563 0.3% 0.3% 1.5% 74.9% 0.4% 0.0% 1.5% 68.9% 178,900 8,184,489 13.7% 26.5% $ Capital Lease Obligations Less current maturities 469,355 (45,675) 3.4% -0.3% 499,900 (43,200) 4.2% -0.4% -6.1% 5.7% Total Liabilities 10,776,243 78.0% 8,641,189 72.7% 24.7% 1.7% Stockholders' equity Common stock Additional paid-in capital Retained earnings 200,000 423,500 2.430,355 3,053,855 13,830,098 1.4% 3.1% 17.6% 22.1% 100.1% 200,000 423,500 2,615,478 3,238,978 11,880,167 3.6% 22.0% 27.3% 100.0% 0.0% 0.0% -7.1% -5.7% 16.4% Plan-1 Ref. No. Prepared by Date KEYSTONE COMPUTERS & NETWORKS, INC. Analytical Procedures Ratios For the Years Ended December 31, WL 1/10/X6 20X5 20X4 Industry 1.1 1.2 1.3 37.0 Current ratio Days sales in average accounts receivable Allowance for doubtful accounts / accounts receivable Bad debt expenseset sales Total liabilities to net worth Return on total assets Return on net worth Return on net sales Gross profitet sales Selling, operating and admin expense / net sales Times interest earned 2.9 9.0% 29.0% 2.3% 24.0% 23.9% 5.5