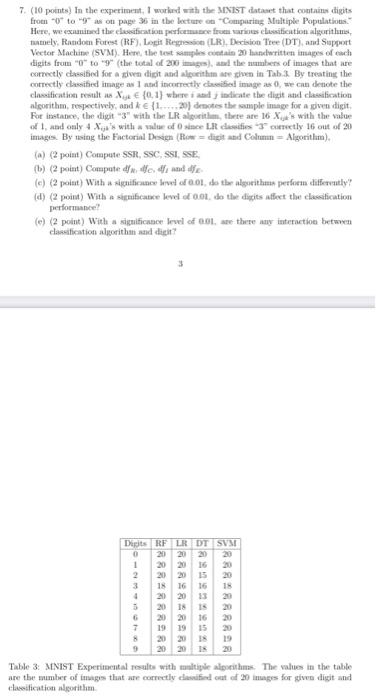
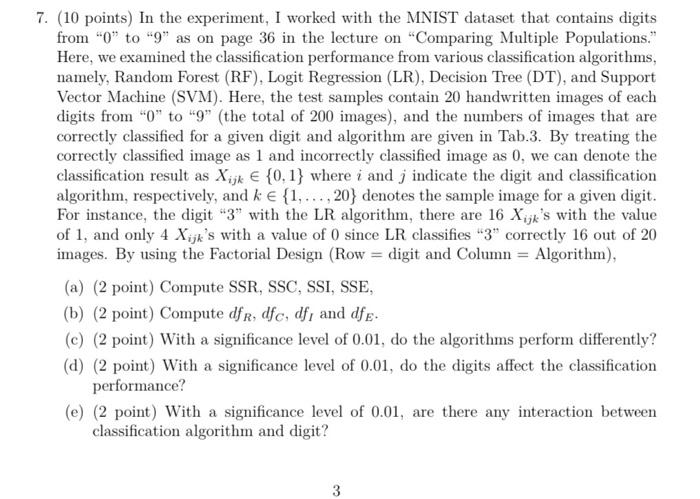
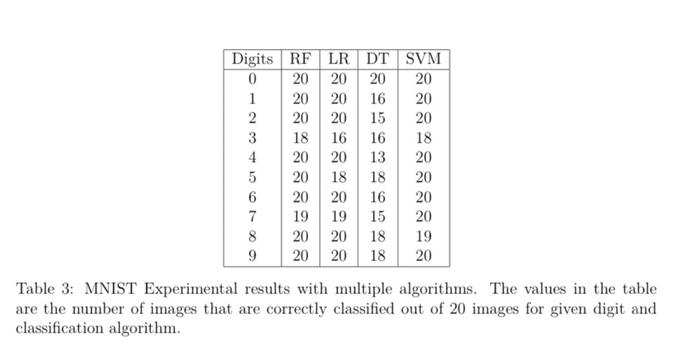
7. (10 points) In the experiment, I worlard with the MNTST datase that contains dipits namely, Ratidoen Forest (RF), Lorit Regriowion (L.R), Deriaion Tree (DT), and Support Vector Machios (SVM). Herre, the test eamples cuetain 20 handwritten images of each correctly chosified for a sives digit and alporithe ate siven in Tab. . By treating the cotrectly clawified intage as 1 atd iscurrectly cherifed inage as 0 , we can denote the algorithm, respectively; and k{1,,20} draves the sample insage for a given digit. Fot instance, the aligit " 3" with the L.R algurithen, thrte are 16Xiuc "s with the value images. By roing the Factorial Dosegn (Plom = digit atd Colmmen = Algorithm), (a) (2 poiat) Cotapute S8IR, SSC, sst, sSE. (b) (2 poist) Compute dfn1, the, df and dife (d) (2 point) With a siguificabe level of 0.01. do the difits affect the clasedication performance? (e) (2 point) With a sigulficance level of a.91, ase there any iateraction betworen clasesification algorithan and dieit? Table 3: MENIST Experimental resulte with maltigse alporithas. The values in the table clawestication algotithem 7. (10 points) In the experiment, I worked with the MNIST dataset that contains digits from "0" to "9" as on page 36 in the lecture on "Comparing Multiple Populations." Here, we examined the classification performance from various classification algorithms, namely, Random Forest (RF), Logit Regression (LR), Decision Tree (DT), and Support Vector Machine (SVM). Here, the test samples contain 20 handwritten images of each digits from "0" to "9" (the total of 200 images), and the numbers of images that are correctly classified for a given digit and algorithm are given in Tab.3. By treating the correctly classified image as 1 and incorrectly classified image as 0 , we can denote the classification result as Xijk{0,1} where i and j indicate the digit and classification algorithm, respectively, and k{1,,20} denotes the sample image for a given digit. For instance, the digit "3" with the LR algorithm, there are 16Xijk 's with the value of 1 , and only 4Xijk 's with a value of 0 since LR classifies "3" correctly 16 out of 20 images. By using the Factorial Design (Row = digit and Column = Algorithm), (a) (2 point) Compute SSR, SSC, SSI, SSE, (b) (2 point) Compute dfR,dfC,dfI and dfE. (c) (2 point) With a significance level of 0.01, do the algorithms perform differently? (d) (2 point) With a significance level of 0.01, do the digits affect the classification performance? (e) (2 point) With a significance level of 0.01, are there any interaction between classification algorithm and digit? Table 3: MNIST Experimental results with multiple algorithms. The values in the table are the number of images that are correctly classified out of 20 images for given digit and classification algorithm. 7. (10 points) In the experiment, I worlard with the MNTST datase that contains dipits namely, Ratidoen Forest (RF), Lorit Regriowion (L.R), Deriaion Tree (DT), and Support Vector Machios (SVM). Herre, the test eamples cuetain 20 handwritten images of each correctly chosified for a sives digit and alporithe ate siven in Tab. . By treating the cotrectly clawified intage as 1 atd iscurrectly cherifed inage as 0 , we can denote the algorithm, respectively; and k{1,,20} draves the sample insage for a given digit. Fot instance, the aligit " 3" with the L.R algurithen, thrte are 16Xiuc "s with the value images. By roing the Factorial Dosegn (Plom = digit atd Colmmen = Algorithm), (a) (2 poiat) Cotapute S8IR, SSC, sst, sSE. (b) (2 poist) Compute dfn1, the, df and dife (d) (2 point) With a siguificabe level of 0.01. do the difits affect the clasedication performance? (e) (2 point) With a sigulficance level of a.91, ase there any iateraction betworen clasesification algorithan and dieit? Table 3: MENIST Experimental resulte with maltigse alporithas. The values in the table clawestication algotithem 7. (10 points) In the experiment, I worked with the MNIST dataset that contains digits from "0" to "9" as on page 36 in the lecture on "Comparing Multiple Populations." Here, we examined the classification performance from various classification algorithms, namely, Random Forest (RF), Logit Regression (LR), Decision Tree (DT), and Support Vector Machine (SVM). Here, the test samples contain 20 handwritten images of each digits from "0" to "9" (the total of 200 images), and the numbers of images that are correctly classified for a given digit and algorithm are given in Tab.3. By treating the correctly classified image as 1 and incorrectly classified image as 0 , we can denote the classification result as Xijk{0,1} where i and j indicate the digit and classification algorithm, respectively, and k{1,,20} denotes the sample image for a given digit. For instance, the digit "3" with the LR algorithm, there are 16Xijk 's with the value of 1 , and only 4Xijk 's with a value of 0 since LR classifies "3" correctly 16 out of 20 images. By using the Factorial Design (Row = digit and Column = Algorithm), (a) (2 point) Compute SSR, SSC, SSI, SSE, (b) (2 point) Compute dfR,dfC,dfI and dfE. (c) (2 point) With a significance level of 0.01, do the algorithms perform differently? (d) (2 point) With a significance level of 0.01, do the digits affect the classification performance? (e) (2 point) With a significance level of 0.01, are there any interaction between classification algorithm and digit? Table 3: MNIST Experimental results with multiple algorithms. The values in the table are the number of images that are correctly classified out of 20 images for given digit and classification algorithm


