Answered step by step
Verified Expert Solution
Link Copied!

Question

1 Approved Answer

7 12 students take two tests. Each test is out of 60. The scatter diagram shows the results for 10 of the students. 60- X
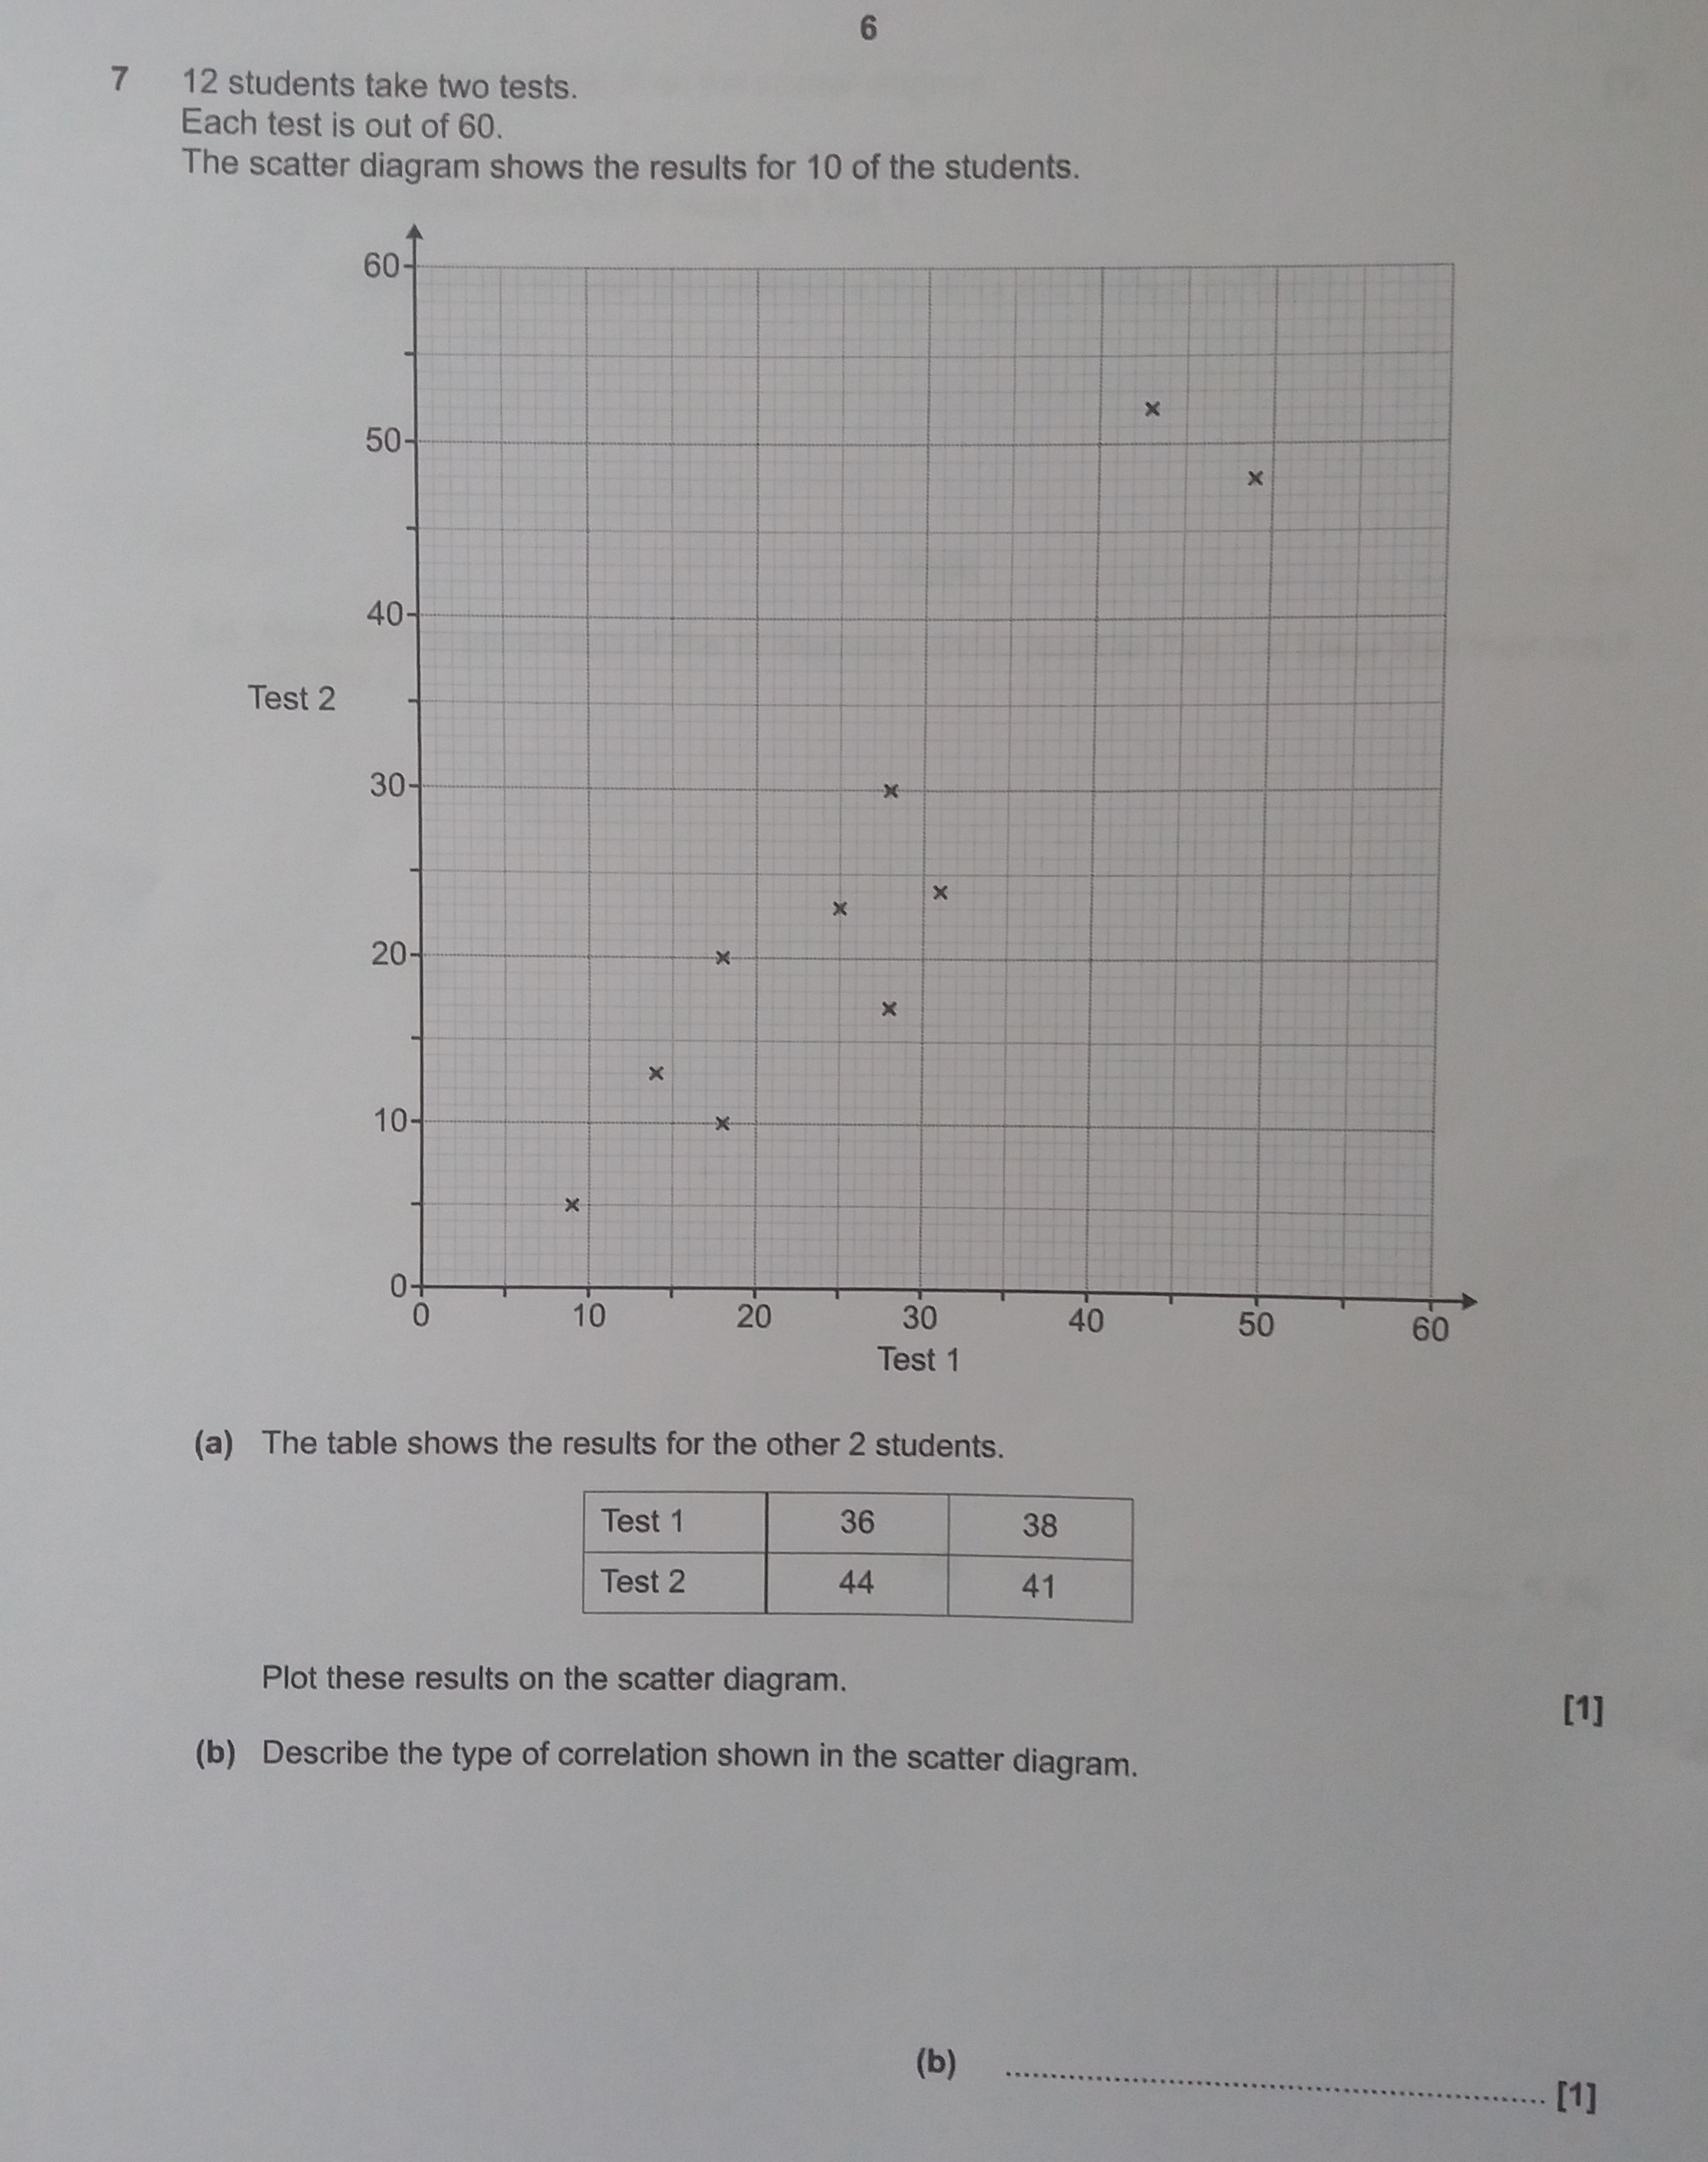
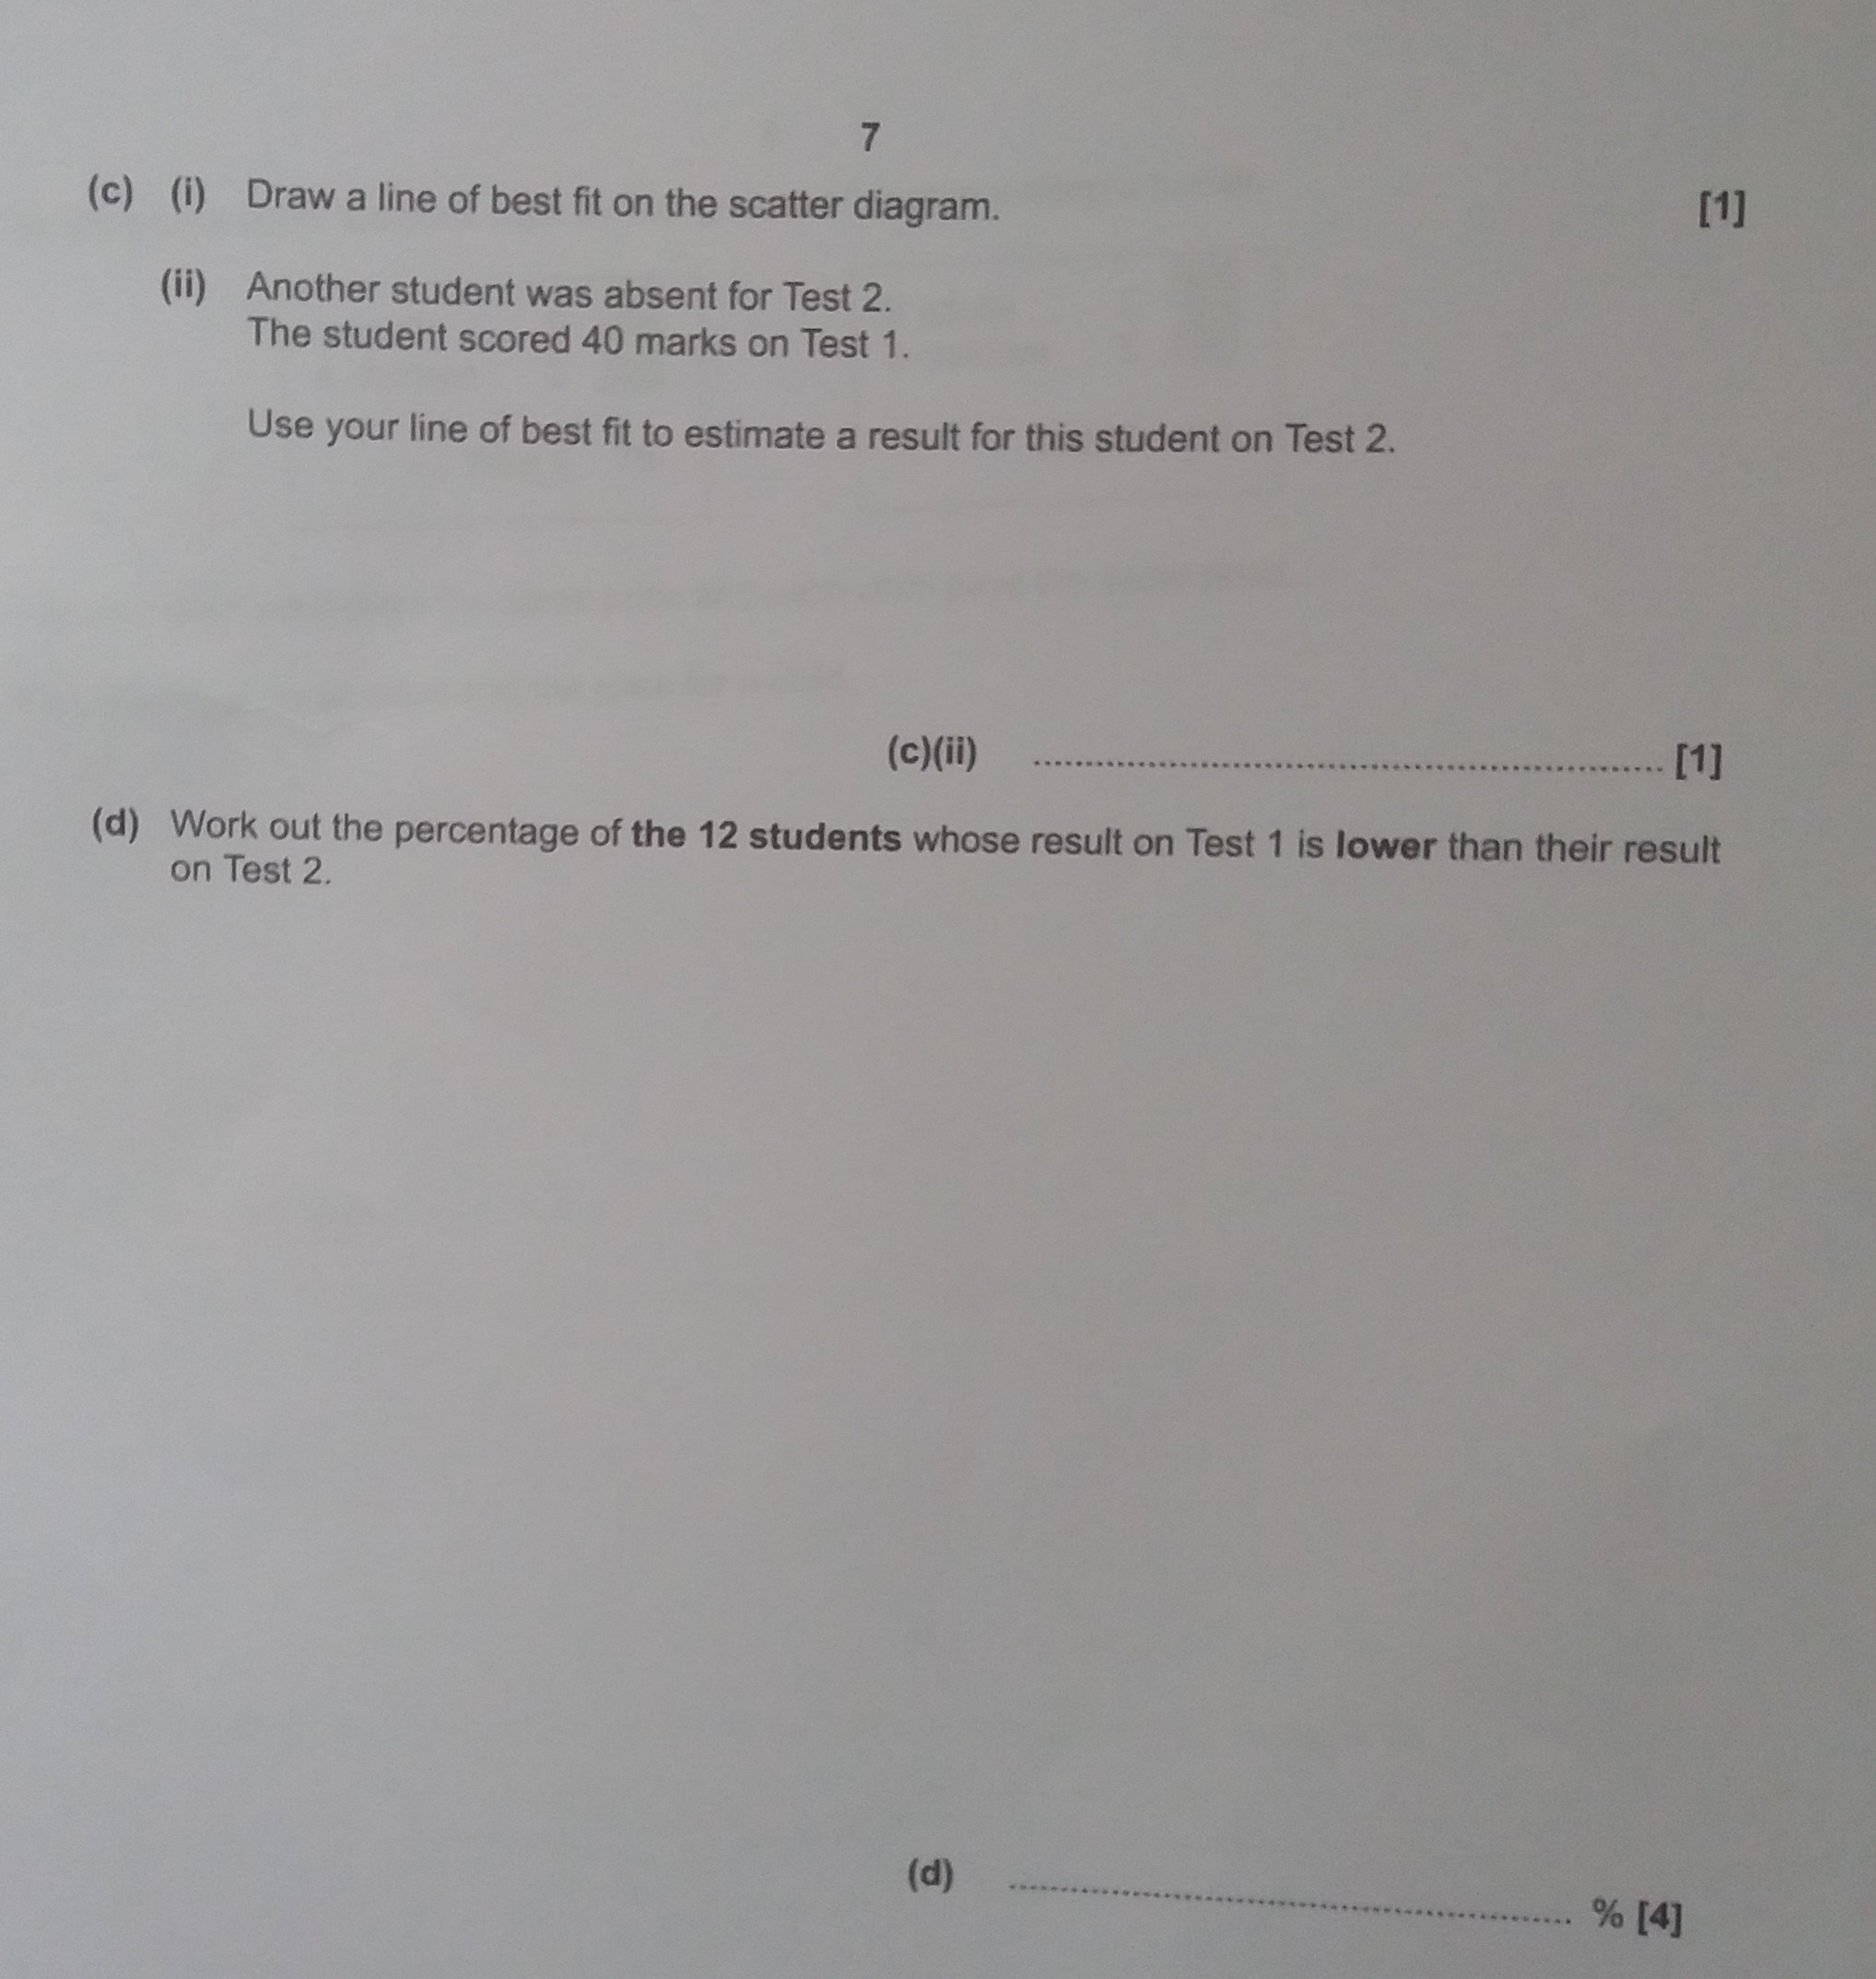
image text in transcribedimage text in transcribed
7 12 students take two tests. Each test is out of 60. The scatter diagram shows the results for 10 of the students. 60- X 50- X 40- Test 2 30- X X 20- X X 10- X- 10 20 30 40 50 60 Test 1 (a) The table shows the results for the other 2 students. Test 1 36 38 Test 2 44 41 Plot these results on the scatter diagram. [1] (b) Describe the type of correlation shown in the scatter diagram. (b) . . . ......... ...... [1]7 (c) (i) Draw a line of best fit on the scatter diagram. [1] (ii) Another student was absent for Test 2. The student scored 40 marks on Test 1. Use your line of best fit to estimate a result for this student on Test 2. (c)(ii) .. [1] (d) Work out the percentage of the 12 students whose result on Test 1 is lower than their result on Test 2. (d) % [4]

Step by Step Solution

There are 3 Steps involved in it

Step: 1

blur-text-image

Get Instant Access to Expert-Tailored Solutions

See step-by-step solutions with expert insights and AI powered tools for academic success

Step: 2

blur-text-image_2

Step: 3

blur-text-image_3

Ace Your Homework with AI

Get the answers you need in no time with our AI-driven, step-by-step assistance

Get Started

Recommended Textbook for

Fundamentals of Investment Management

Authors: Geoffrey Hirt, Stanley Block

10th edition

0078034620, 978-0078034626

Students also viewed these Mathematics questions