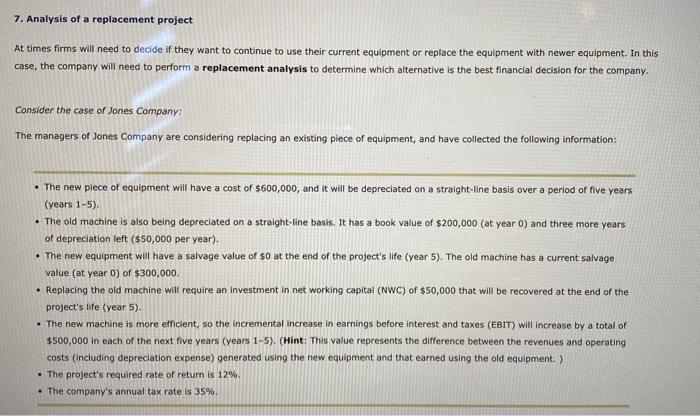
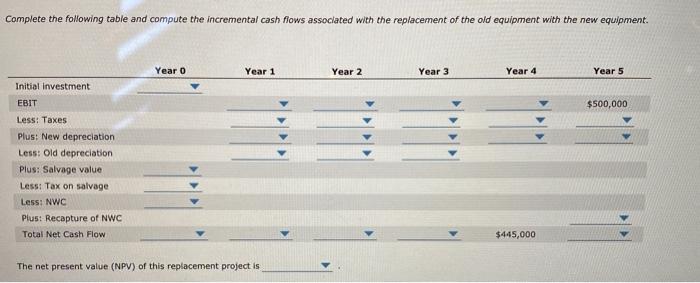
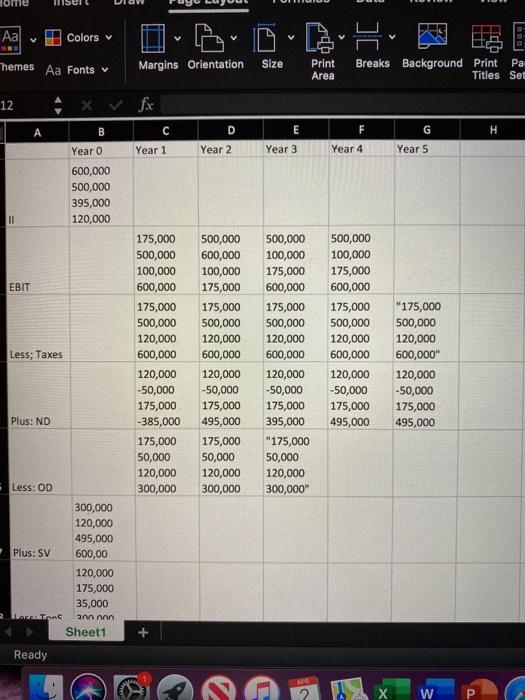
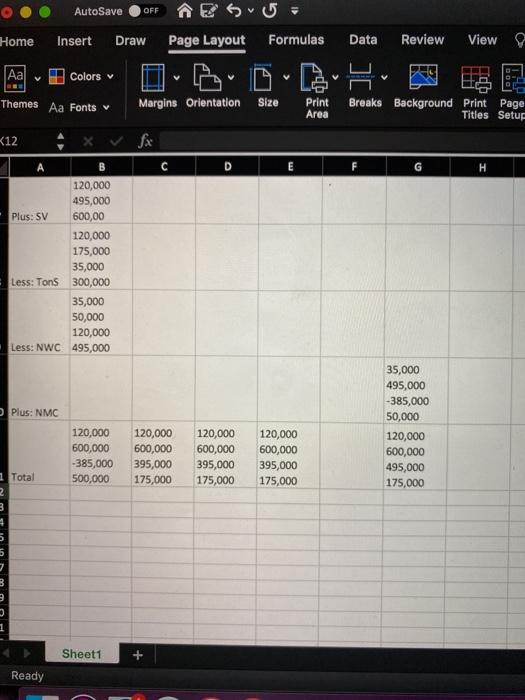
7. Analysis of a replacement project At times firms will need to decide if they want to continue to use their current equipment or replace the equipment with newer equipment. In this case, the company will need to perform a replacement analysis to determine which alternative is the best financial decision for the company. Consider the case of Jones Company: The managers of Jones Company are considering replacing an existing piece of equipment, and have collected the following information: The new piece of equipment will have a cost of $600,000, and it will be depreciated on a straight-line basis over a period of five years (years 1-5). The old machine is also being depreciated on a straight-line basis. It has a book value of $200,000 (at year 0) and three more years of depreciation left ($50,000 per year). The new equipment will have a salvage value of $0 at the end of the project's life (year 5). The old machine has a current salvage value (at year 0) of $300,000. Replacing the old machine will require an investment in net working capital (NWC) of $50,000 that will be recovered at the end of the project's life (year 5). The new machine is more efficient, so the incremental increase in earnings before interest and taxes (EBIT) will increase by a total of $500,000 in each of the next five years (years 1-5). (Hint: This value represents the difference between the revenues and operating costs (including depreciation expense) generated using the new equipment and that earned using the old equipment. ) The project's required rate of return is 12% The company's annual tax rate is 35%. Complete the following table and compute the incremental cash flows associated with the replacement of the old equipment with the new equipment. Year o Year 1 Year 2 Year 3 Year 4 Year 5 Initial Investment EBIT $500,000 Less: Taxes Plus: New depreciation Less: Old depreciation Plus: Salvage value Less: Tax on salvage Less: NWC Plus: Recapture of NWC Total Net Cash Flow $445,000 The net present value (NPV) of this replacement project is ome HISEI Colors DO Themes Aa Fonts Margins Orientation Size Print Area Breaks Background Print Pa Titles Set 12 x v fx A B D E G Year o Year 1 Year 2 Year 3 Year 4 Year 5 600,000 500,000 395,000 120,000 EBIT 175,000 500,000 100,000 600,000 175,000 500,000 120,000 600,000 120,000 -50,000 175,000 -385,000 175,000 50,000 120,000 300,000 Less; Taxes 500,000 600,000 100,000 175,000 175,000 500,000 120,000 600,000 120,000 -50,000 175,000 495,000 175,000 50,000 120,000 300,000 500,000 100,000 175,000 600,000 175,000 500,000 120,000 600,000 120,000 -50,000 175,000 395,000 "175,000 50,000 120,000 300,000" 500,000 100,000 175,000 600,000 175,000 500,000 120,000 600,000 120,000 -50,000 175,000 495,000 "175,000 500,000 120,000 600,000" 120,000 -50,000 175,000 495,000 Plus: ND Less: OD 300,000 120,000 495,000 Plus: SV 600,00 120,000 175,000 35,000 Raccoons am non Sheet1 Ready W AutoSave OFF Home Insert Draw Page Layout Formulas Data Review View Aa Colors Themes Aa Fonts Margins Orientation Size Print Area Breaks Background Print Page Titles Setup 12 fx D H A B 120,000 495,000 Plus: SV 600,00 120,000 175,000 35,000 Less: Tons 300,000 35,000 50,000 120,000 Less: NWC 495,000 Plus: NMC 35,000 495,000 -385,000 50,000 120,000 600,000 495,000 175,000 120,000 600,000 -385,000 500,000 120,000 600,000 395,000 175,000 120,000 600,000 395,000 175,000 120,000 600,000 395,000 175,000 1 Total 2 3 o 1 Sheet1 Ready
