

Answered step by step
Verified Expert Solution
Question
1 Approved Answer
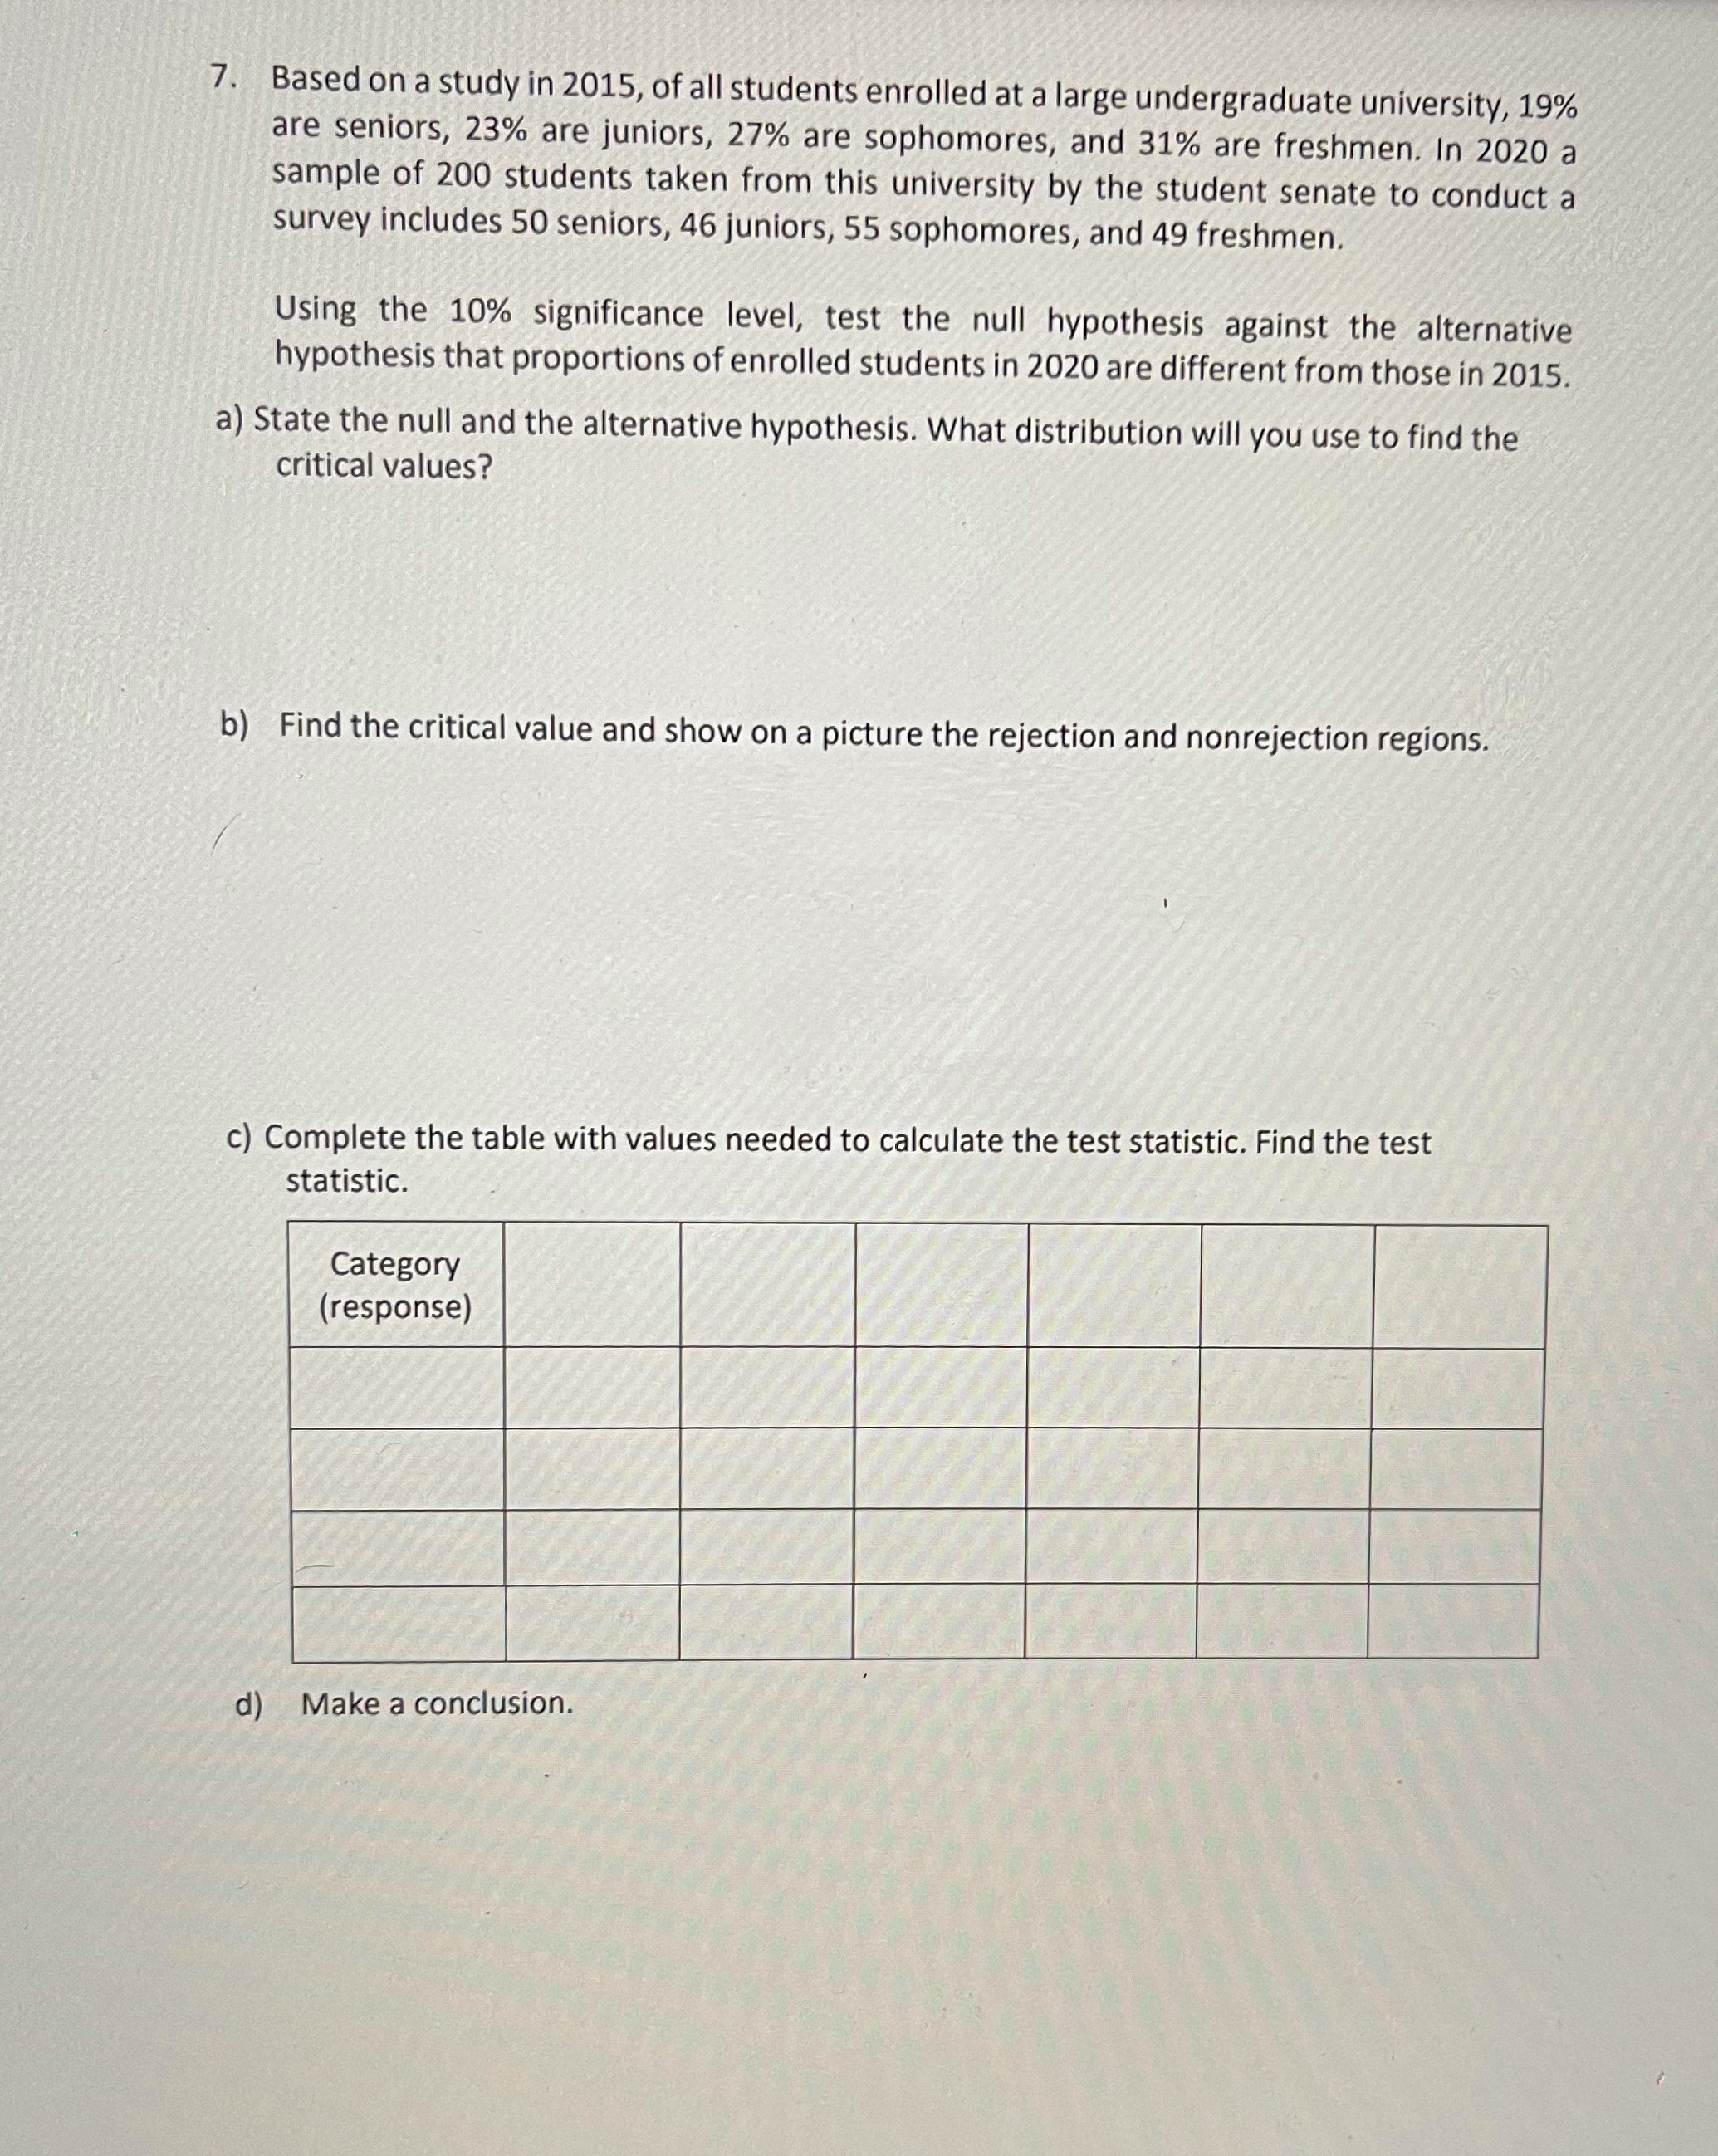
7. Based on a study in 2015, of all students enrolled at a large undergraduate university, 19% are seniors, 23% are juniors, 27% are sophomores,
Step by Step Solution
There are 3 Steps involved in it
Step: 1

Get Instant Access to Expert-Tailored Solutions
See step-by-step solutions with expert insights and AI powered tools for academic success
Step: 2

Step: 3
Ace Your Homework with AI
Get the answers you need in no time with our AI-driven, step-by-step assistance
Get Started
Calculus I With Integrated Precalculus
Authors: Laura Taalman
1st Edition
1464153027, 9781464153020