Question
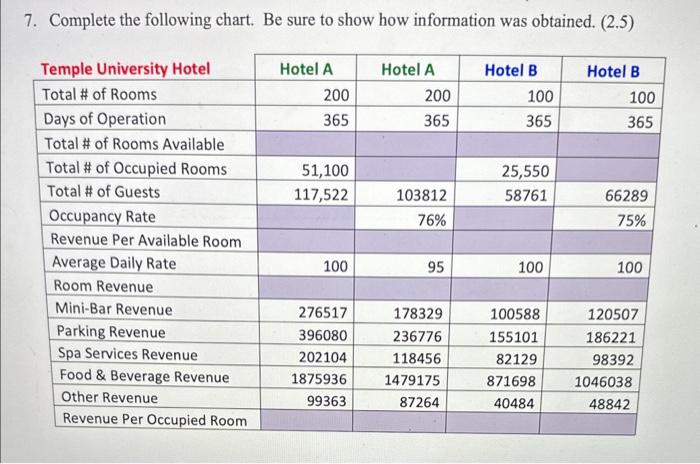
7. Complete the following chart. Be sure to show how information was obtained. (2.5) Temple University Hotel Total # of Rooms Days of Operation

7. Complete the following chart. Be sure to show how information was obtained. (2.5) Temple University Hotel Total # of Rooms Days of Operation Total # of Rooms Available Total # of Occupied Rooms Total # of Guests Occupancy Rate Revenue Per Available Room Average Daily Rate Room Revenue Mini-Bar Revenue Parking Revenue Spa Services Revenue Food & Beverage Revenue Other Revenue Revenue Per Occupied Room Hotel A 200 365 51,100 117,522 100 276517 396080 202104 1875936 99363 Hotel A 200 365 103812 76% 95 178329 236776 118456 1479175 87264 Hotel B 100 365 25,550 58761 100 100588 155101 82129 871698 40484 Hotel B 100 365 66289 75% 100 120507 186221 98392 1046038 48842
Step by Step Solution
3.36 Rating (146 Votes )
There are 3 Steps involved in it
Step: 1
Answer To complete the chart we need to calculate the Revenue Per Occupied Room for each h...
Get Instant Access to Expert-Tailored Solutions
See step-by-step solutions with expert insights and AI powered tools for academic success
Step: 2

Step: 3

Ace Your Homework with AI
Get the answers you need in no time with our AI-driven, step-by-step assistance
Get StartedRecommended Textbook for
Income Tax Fundamentals 2013
Authors: Gerald E. Whittenburg, Martha Altus Buller, Steven L Gill
31st Edition
1111972516, 978-1285586618, 1285586611, 978-1285613109, 978-1111972516
Students also viewed these General Management questions
Question
Answered: 1 week ago
Question
Answered: 1 week ago
Question
Answered: 1 week ago
Question
Answered: 1 week ago
Question
Answered: 1 week ago
Question
Answered: 1 week ago
Question
Answered: 1 week ago
Question
Answered: 1 week ago
Question
Answered: 1 week ago
Question
Answered: 1 week ago
Question
Answered: 1 week ago
Question
Answered: 1 week ago
Question
Answered: 1 week ago
Question
Answered: 1 week ago
Question
Answered: 1 week ago
Question
Answered: 1 week ago
Question
Answered: 1 week ago
Question
Answered: 1 week ago
Question
Answered: 1 week ago
Question
Answered: 1 week ago
Question
Answered: 1 week ago
Question
Answered: 1 week ago
View Answer in SolutionInn App


