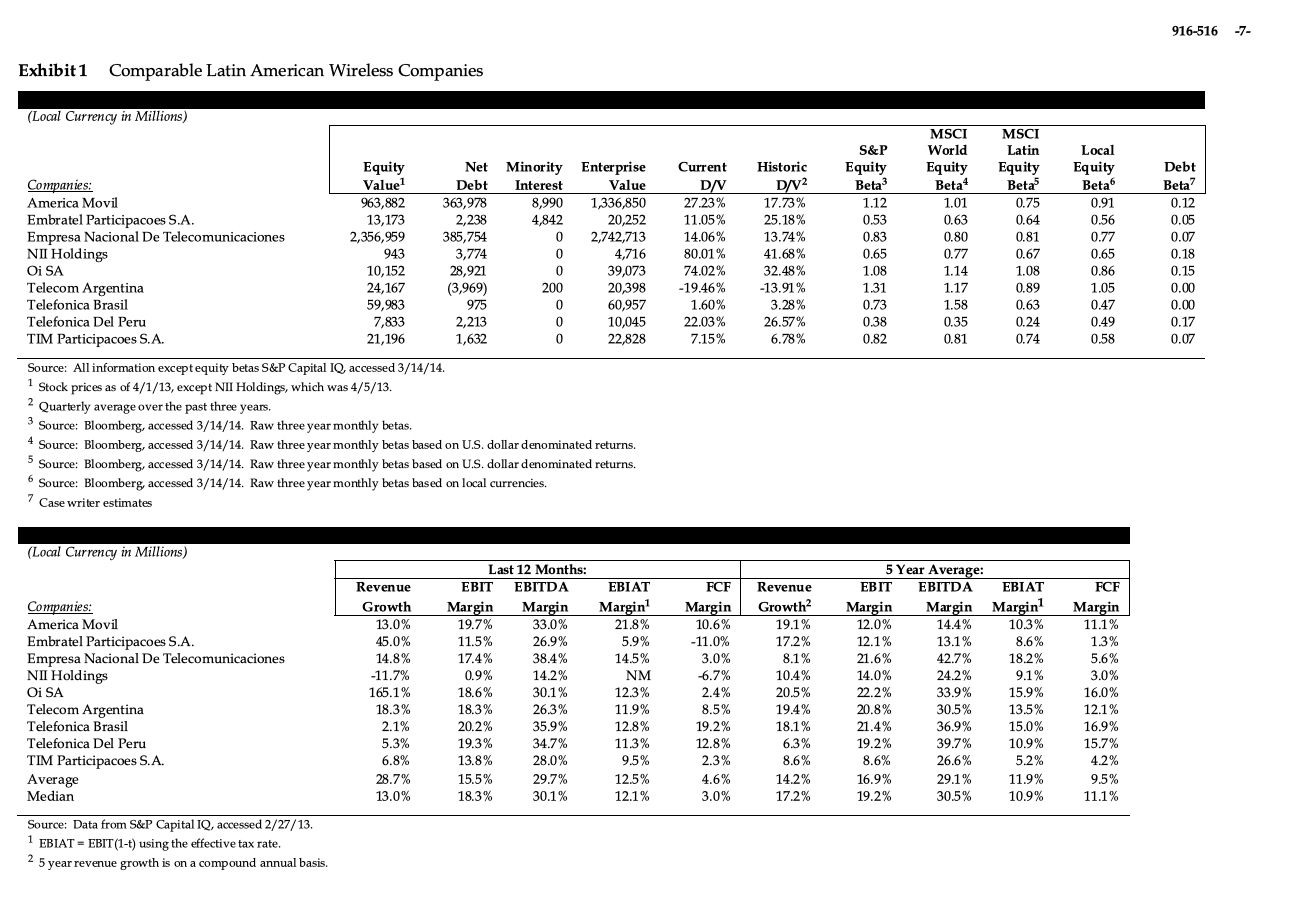
7. Estimate the cost of capital of NII Holdings assuming investors are globally diversified.
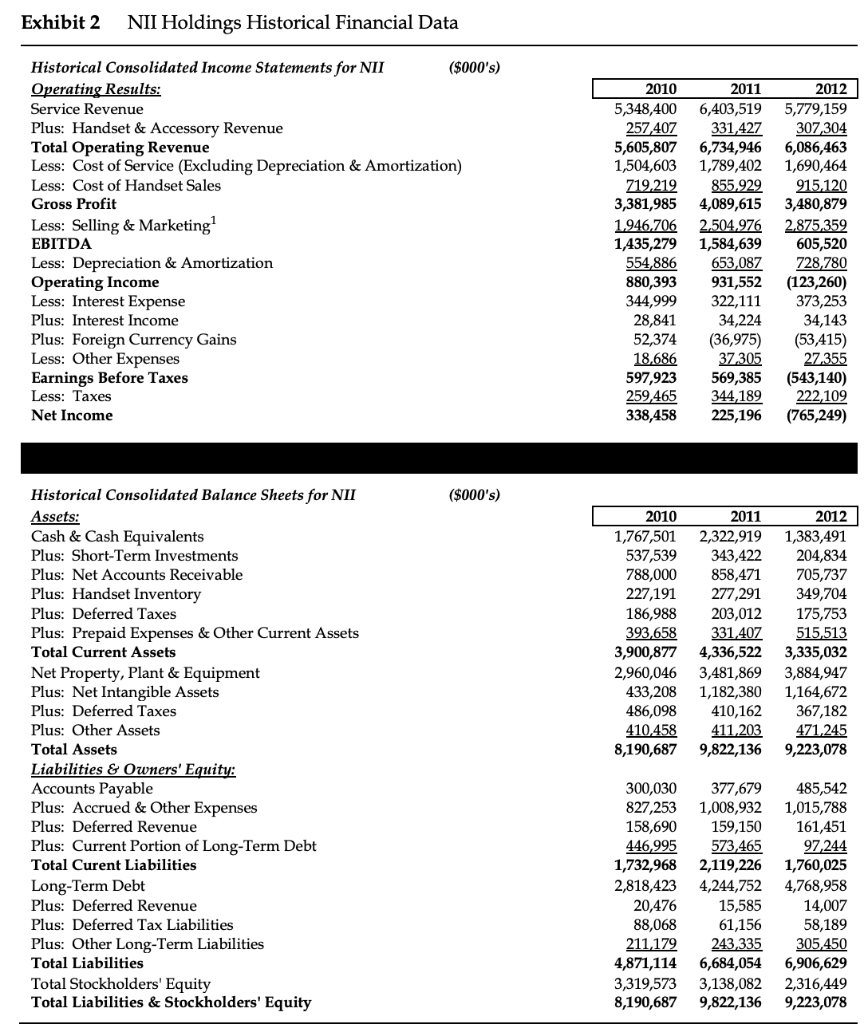
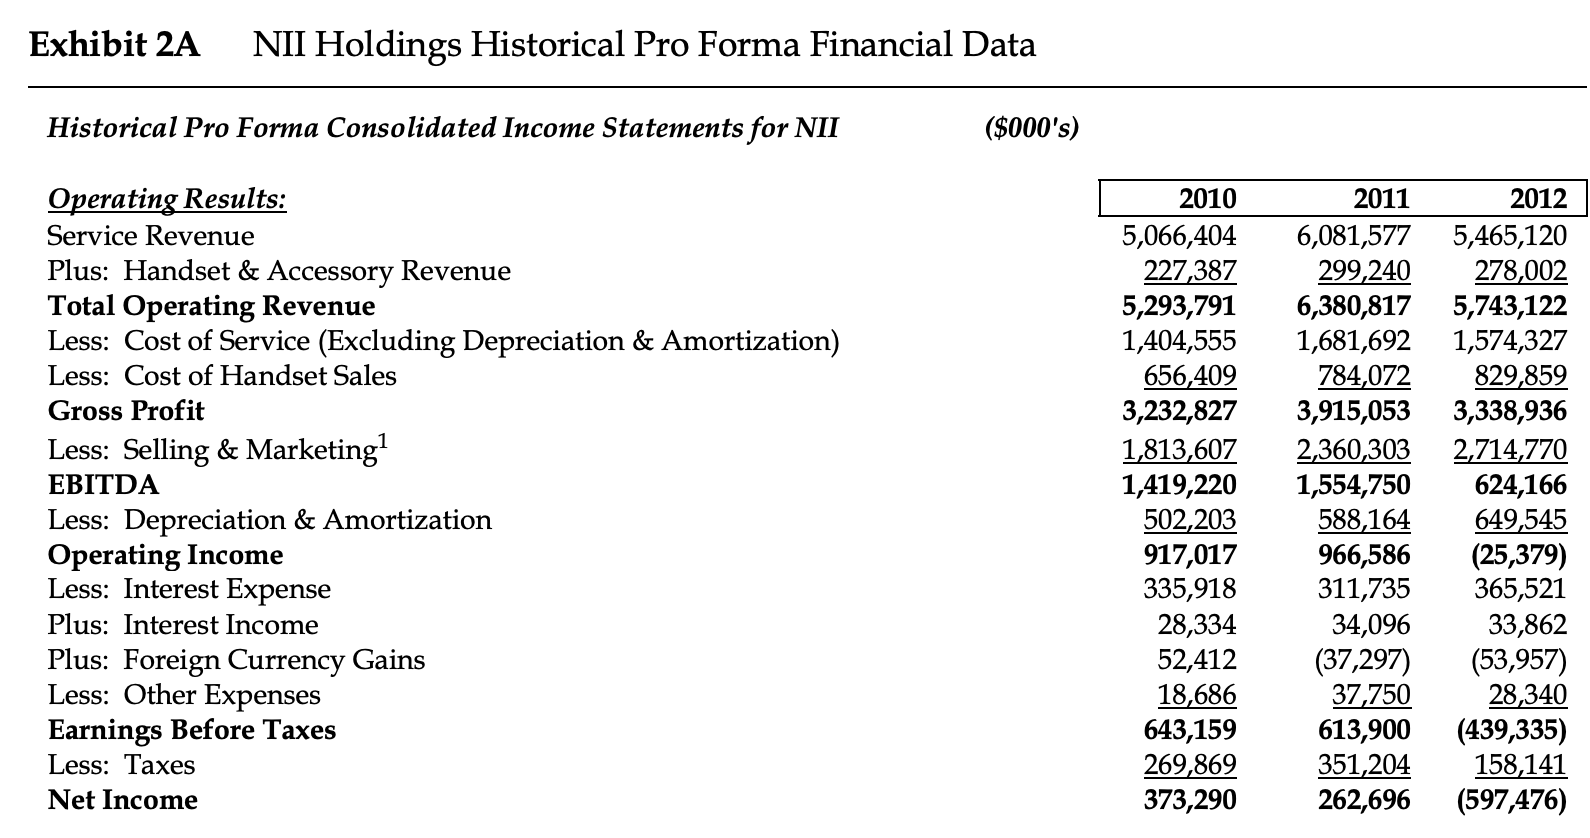
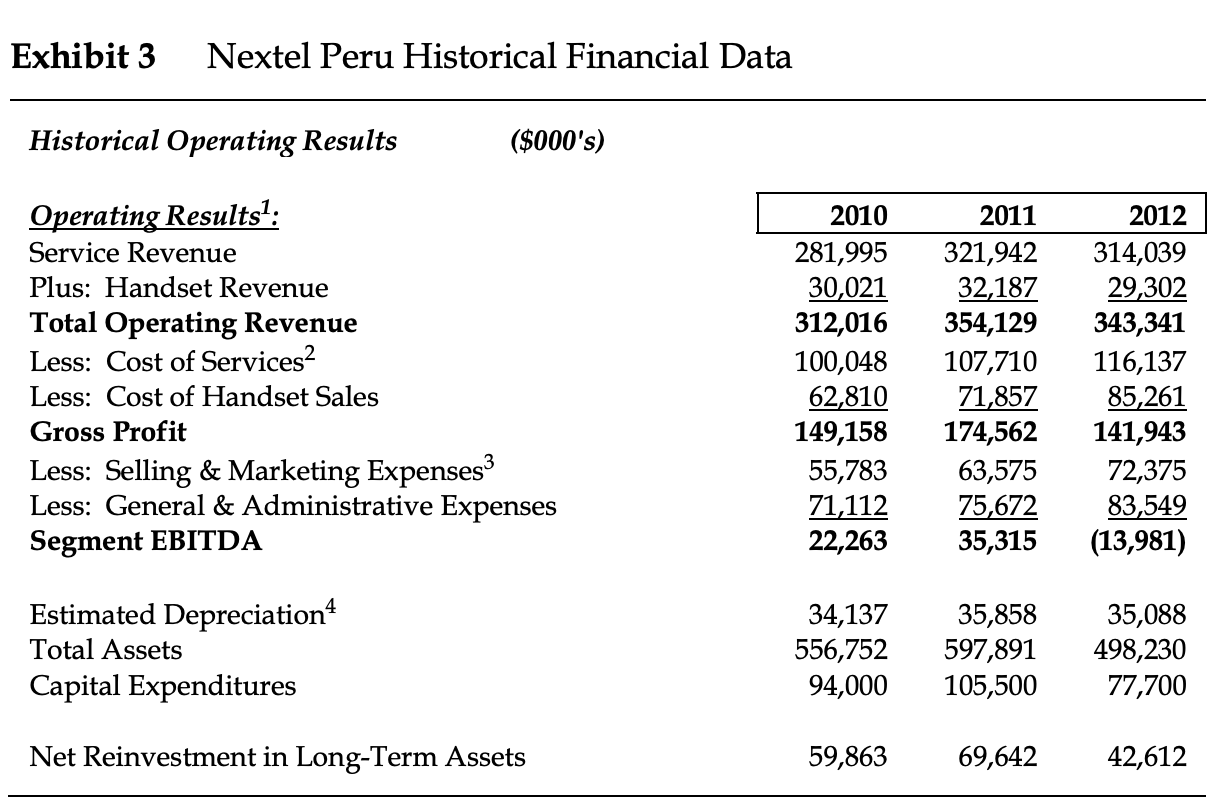
8. What do you think the appropriate growth rate of expected cash flows should be for Nextel Peru. Explain your choice.
9. Estimate the value of Nextel Peru. How does it compare to the price Entel is offering? Use your answers to Questions 7 and 8 in your calculations. How much confidence do you have in your answer?


916-516 -7- Exhibit 1 Comparable Latin American Wireless Companies (Local Currency in Millions) MSCI MSCI World Equity Beta4 Local S&P Latin Net Minority Debt 363,978 Enterprise Historic Debt Equity Value Current Equity Beta3 Equity Beta Equity Beta Beta 0.12 D/V2 17.73% mpanies: America Movil Interest Value D/V 27.23% 963,882 8,990 1,336,850 1.12 1.01 0.75 0.91 Embratel Participacoes S.A Empresa Nacional De Telecomunicaciones NII Holdings 13,173 2,238 4,842 20,252 2,742,713 11.05% 25.18% 0.53 0.63 0.64 0.56 0.05 385,754 3,774 0.81 0.07 2,356,959 0 14.06% 13.74% 0.83 0.80 0.77 41.68% 32.48% 80.01% 0.18 943 0 4,716 0.65 0.77 0.67 0.65 28,921 (3,969) 10,152 24,167 74.02% 1.08 Oi SA 39,073 1.08 1.14 0.86 0.15 Telecom Argentina Telefonica Brasil 20,398 200 -19.46% -13.91% 131 1.17 0.89 1.05 0.00 3.28% 1.60% 59,983 975 0 60,957 0.73 1.58 0.63 0.47 0.00 Telefonica Del Peru 26.57% 0.49 7,833 2,213 0 10,045 22,828 22.03% 0.38 0.35 0.24 0.17 TIM Participacoes S. A 21,196 7.15% 6.78% 0.74 1,632 0 0.82 0.81 0.58 0.07 Source: All information exceptequity betas S&P Capital IQ, accessed 3/14/14. Stock prices as of 4/1/13, except NII Holdings, which was 4/5/13. 2 Quarterly average over the past three years. Source: Bloomberg, accessed 3/14/14. Raw three year monthly betas Source: Bloomberg, accessed 3/14/14. Raw three year monthly betas based on U.S. dollar denominated returns Source: Bloomberg, accessed 3/14/14. Raw three year monthly betas based on U.S. dollar denominated returns 6 Source: Bloomberg, accessed 3/14/14. Raw three year monthly betas based on local currencies. 7 Case writer estimates 3 4 7 (Local Currency in Millions) Last 12 Months 5 Year Average: IT FCF EBITDA Revenue EBITDA BIAT Revenue BIT EBIAT FCF Margin Margin1 14.4% Growth2 Margin Companies America Movil Embratel Participacoes S.A Empresa Nacional De Telecomunicaciones NII Holdings Oi SA Telecom Argentina Growth Margin 33.0% Margin Margin 19.7% Margin 10.6% Margin 12.0% 13.0% 21.8% 19.1% 10.3% 11.1% 8.6% 18.2% 9.1% 15.9% 26.9% 12.1% 45.0% 11.5% 5.9% -11.0% 17.2% 8.1% 13,1% 1.3% 5.6% 14.8% 17.4% 38.4% 14.5% 3.0% 21.6% 42.7% 0.9% 24.2% -11.7% 14.2% NM -6.7% 10.4% 14.0% 3.0% 30.1% 20.5% 165.1% 12.3% 2.4% 22.2% 33.9% 16.0% 18.6% 18.3% 18.3% 11.9% 20.8% 26.3% 8.5% 19.4% 30.5% 13.5% 12,1% Telefonica Brasil 2.1% 20.2% 35.9% 12.8% 19.2% 18.1% 21.4% 36.9% 15.0% 16.9% Telefonica Del Peru 11.3% 12.8% 6.3% 8.6% 19.2% 5.3% 19.3% 34.7% 39.7% 10.9% 15.7% TIM Participacoes S.A Average Median 26.6% 6.8% 13.8% 28.0% 9,5% 2.3% 8.6% 5.2% 4.2% 16.9% 19.2% 12.5% 28.7% 15.5% 29.7% 4.6% 14.2% 29.1% 11.9% 9.5% 13.0% 17.2% 30.5% 18.3% 30.1% 12.1% 3.0% 10.9% 11.1% Source: Data from S&P Capital IQ, accessed 2/27/13. 1 EBIAT EBIT (1-t) using the effective tax rate 2 5 year revenue growth is on a compound annual basis. Exhibit 2 NII Holdings Historical Financial Data Historical Consolidated Income Statements for NII Operating Results: Service Revenue ($000's) 2012 5,779,159 307,304 6,086,463 1,690,464 915,120 3,480,879 2.875,359 605,520 2010 2011 6,403,519 331,427 6,734,946 1,789,402 855.929 4,089,615 5,348,400 257,407 5,605,807 1,504,603 Plus: Handset & Accessory Revenue Total Operating Revenue Less: Cost of Service (Excluding Depreciation & Amortization) Less: Cost of Handset Sales Z19,219 3,381,985 Gross Profit Less: Selling & Marketing 2.504,976 1,584,639 653,087 931,552 322,111 34,224 (36,975) 37.305 569,385 344,189 225,196 1.946,706 1,435,279 554,886 EBITDA Less: Depreciation & Amortization Operating Income Less: Interest Expense 728,780 (123,260) 373,253 34,143 (53,415) 27.355 880,393 344,999 Plus: Interest Income 28,841 52,374 18.686 597,923 259,465 338,458 Plus: Foreign Currency Gains Less: Other Expenses Earnings Before Taxes Less: Taxes (543,140) 222,109 (765,249) Net Income ($000's) Historical Consolidated Balance Sheets for NII 2010 2012 Assets: Cash & Cash Equivalents 2011 1,767,501 537,539 788,000 227,191 2,322,919 343,422 858,471 277,291 1,383,491 204,834 Plus: Short-Term Investments Plus: Net Accounts Receivable 705,737 349,704 175,753 515,513 Plus: Handset Inventory Plus: Deferred Taxes 203,012 331,407 4,336,522 186,988 Plus: Prepaid Expenses & Other Current Assets 393,658 3,900,877 2,960,046 433,208 486,098 410.458 8,190,687 Total Current Assets 3,335,032 Net Property, Plant & Equipment Plus: Net Intangible Assets Plus: Deferred Taxes 3,481,869 1,182,380 410,162 411.203 9,822,136 3,884,947 1,164,672 367,182 471,245 Plus: Other Assets Total Assets 9,223,078 Liabilities & Owners' Equity: Accounts Payable Plus: Accrued & Other Expenses 300,030 827,253 158,690 377,679 1,008,932 159,150 485,542 1,015,788 161,451 Plus: Deferred Revenue 573,465 2,119,226 4,244,752 15,585 61,156 243,335 6,684,054 3,138,082 9,822,136 97,244 1,760,025 4,768,958 Plus: Current Portion of Long-Term Debt Total Curent Liabilities 446,995 1,732,968 Long-Term Debt Plus: Deferred Revenue 2,818,423 20,476 14,007 58,189 Plus: Deferred Tax Liabilities 88,068 305.450 6,906,629 2,316,449 9,223,078 Plus: Other Long-Term Liabilities 211,179 4,871,114 3,319,573 8,190,687 Total Liabilities Total Stockholders' Equity Total Liabilities & Stockholders' Equity NII Holdings Historical Pro Forma Financial Data Exhibit 2A Historical Pro Forma Consolidated Income Statements for NII ($000's) Operating Results: Service Revenue 2011 2010 2012 5,066,404 227,387 5,293,791 1,404,555 656,409 3,232,827 5,465,120 278,002 5,743,122 1,574,327 829,859 3,338,936 6,081,577 299,240 6,380,817 1,681,692 784,072 3,915,053 Plus: Handset & Accessory Revenue Total Operating Revenue Less: Cost of Service (Excluding Depreciation & Amortization) Less: Cost of Handset Sales Gross Profit Less: Selling & Marketing 1,813,607 1,419,220 502,203 917,017 335,918 2,360,303 1,554,750 588,164 966,586 311,735 34,096 (37,297) 37,750 613,900 351,204 262,696 2,714,770 624,166 649,545 (25,379) 365,521 33,862 (53,957) 28,340 (439,335) 158,141 (597,476) EBITDA Less: Depreciation & Amortization Operating Income Less: Interest Expense Plus: Interest Income 28,334 52,412 18,686 643,159 269,869 373,290 Plus: Foreign Currency Gains Less: Other Expenses Earnings Before Taxes Less: Taxes Net Income Exhibit 3 Nextel Peru Historical Financial Data Historical Operating Results ($000's) Operating Results 2010 2011 2012 281,995 30,021 312,016 314,039 29,302 343,341 Service Revenue 321,942 32,187 354,129 107,710 71,857 174,562 Plus: Handset Revenue Total Operating Revenue Less: Cost of Services2 100,048 62,810 149,158 116,137 85,261 141,943 Less: Cost of Handset Sales Gross Profit Less: Selling & Marketing Expenses3 Less: General & Administrative Expenses Segment EBITDA 63,575 75,672 35,315 55,783 71,112 22,263 72,375 83,549 (13,981) Estimated Depreciation4 Total Assets 34,137 556,752 94,000 35,088 498,230 35,858 597,891 105,500 Capital Expenditures 77,700 69,642 Net Reinvestment in Long-Term Assets 59,863 42,612 916-516 -7- Exhibit 1 Comparable Latin American Wireless Companies (Local Currency in Millions) MSCI MSCI World Equity Beta4 Local S&P Latin Net Minority Debt 363,978 Enterprise Historic Debt Equity Value Current Equity Beta3 Equity Beta Equity Beta Beta 0.12 D/V2 17.73% mpanies: America Movil Interest Value D/V 27.23% 963,882 8,990 1,336,850 1.12 1.01 0.75 0.91 Embratel Participacoes S.A Empresa Nacional De Telecomunicaciones NII Holdings 13,173 2,238 4,842 20,252 2,742,713 11.05% 25.18% 0.53 0.63 0.64 0.56 0.05 385,754 3,774 0.81 0.07 2,356,959 0 14.06% 13.74% 0.83 0.80 0.77 41.68% 32.48% 80.01% 0.18 943 0 4,716 0.65 0.77 0.67 0.65 28,921 (3,969) 10,152 24,167 74.02% 1.08 Oi SA 39,073 1.08 1.14 0.86 0.15 Telecom Argentina Telefonica Brasil 20,398 200 -19.46% -13.91% 131 1.17 0.89 1.05 0.00 3.28% 1.60% 59,983 975 0 60,957 0.73 1.58 0.63 0.47 0.00 Telefonica Del Peru 26.57% 0.49 7,833 2,213 0 10,045 22,828 22.03% 0.38 0.35 0.24 0.17 TIM Participacoes S. A 21,196 7.15% 6.78% 0.74 1,632 0 0.82 0.81 0.58 0.07 Source: All information exceptequity betas S&P Capital IQ, accessed 3/14/14. Stock prices as of 4/1/13, except NII Holdings, which was 4/5/13. 2 Quarterly average over the past three years. Source: Bloomberg, accessed 3/14/14. Raw three year monthly betas Source: Bloomberg, accessed 3/14/14. Raw three year monthly betas based on U.S. dollar denominated returns Source: Bloomberg, accessed 3/14/14. Raw three year monthly betas based on U.S. dollar denominated returns 6 Source: Bloomberg, accessed 3/14/14. Raw three year monthly betas based on local currencies. 7 Case writer estimates 3 4 7 (Local Currency in Millions) Last 12 Months 5 Year Average: IT FCF EBITDA Revenue EBITDA BIAT Revenue BIT EBIAT FCF Margin Margin1 14.4% Growth2 Margin Companies America Movil Embratel Participacoes S.A Empresa Nacional De Telecomunicaciones NII Holdings Oi SA Telecom Argentina Growth Margin 33.0% Margin Margin 19.7% Margin 10.6% Margin 12.0% 13.0% 21.8% 19.1% 10.3% 11.1% 8.6% 18.2% 9.1% 15.9% 26.9% 12.1% 45.0% 11.5% 5.9% -11.0% 17.2% 8.1% 13,1% 1.3% 5.6% 14.8% 17.4% 38.4% 14.5% 3.0% 21.6% 42.7% 0.9% 24.2% -11.7% 14.2% NM -6.7% 10.4% 14.0% 3.0% 30.1% 20.5% 165.1% 12.3% 2.4% 22.2% 33.9% 16.0% 18.6% 18.3% 18.3% 11.9% 20.8% 26.3% 8.5% 19.4% 30.5% 13.5% 12,1% Telefonica Brasil 2.1% 20.2% 35.9% 12.8% 19.2% 18.1% 21.4% 36.9% 15.0% 16.9% Telefonica Del Peru 11.3% 12.8% 6.3% 8.6% 19.2% 5.3% 19.3% 34.7% 39.7% 10.9% 15.7% TIM Participacoes S.A Average Median 26.6% 6.8% 13.8% 28.0% 9,5% 2.3% 8.6% 5.2% 4.2% 16.9% 19.2% 12.5% 28.7% 15.5% 29.7% 4.6% 14.2% 29.1% 11.9% 9.5% 13.0% 17.2% 30.5% 18.3% 30.1% 12.1% 3.0% 10.9% 11.1% Source: Data from S&P Capital IQ, accessed 2/27/13. 1 EBIAT EBIT (1-t) using the effective tax rate 2 5 year revenue growth is on a compound annual basis. Exhibit 2 NII Holdings Historical Financial Data Historical Consolidated Income Statements for NII Operating Results: Service Revenue ($000's) 2012 5,779,159 307,304 6,086,463 1,690,464 915,120 3,480,879 2.875,359 605,520 2010 2011 6,403,519 331,427 6,734,946 1,789,402 855.929 4,089,615 5,348,400 257,407 5,605,807 1,504,603 Plus: Handset & Accessory Revenue Total Operating Revenue Less: Cost of Service (Excluding Depreciation & Amortization) Less: Cost of Handset Sales Z19,219 3,381,985 Gross Profit Less: Selling & Marketing 2.504,976 1,584,639 653,087 931,552 322,111 34,224 (36,975) 37.305 569,385 344,189 225,196 1.946,706 1,435,279 554,886 EBITDA Less: Depreciation & Amortization Operating Income Less: Interest Expense 728,780 (123,260) 373,253 34,143 (53,415) 27.355 880,393 344,999 Plus: Interest Income 28,841 52,374 18.686 597,923 259,465 338,458 Plus: Foreign Currency Gains Less: Other Expenses Earnings Before Taxes Less: Taxes (543,140) 222,109 (765,249) Net Income ($000's) Historical Consolidated Balance Sheets for NII 2010 2012 Assets: Cash & Cash Equivalents 2011 1,767,501 537,539 788,000 227,191 2,322,919 343,422 858,471 277,291 1,383,491 204,834 Plus: Short-Term Investments Plus: Net Accounts Receivable 705,737 349,704 175,753 515,513 Plus: Handset Inventory Plus: Deferred Taxes 203,012 331,407 4,336,522 186,988 Plus: Prepaid Expenses & Other Current Assets 393,658 3,900,877 2,960,046 433,208 486,098 410.458 8,190,687 Total Current Assets 3,335,032 Net Property, Plant & Equipment Plus: Net Intangible Assets Plus: Deferred Taxes 3,481,869 1,182,380 410,162 411.203 9,822,136 3,884,947 1,164,672 367,182 471,245 Plus: Other Assets Total Assets 9,223,078 Liabilities & Owners' Equity: Accounts Payable Plus: Accrued & Other Expenses 300,030 827,253 158,690 377,679 1,008,932 159,150 485,542 1,015,788 161,451 Plus: Deferred Revenue 573,465 2,119,226 4,244,752 15,585 61,156 243,335 6,684,054 3,138,082 9,822,136 97,244 1,760,025 4,768,958 Plus: Current Portion of Long-Term Debt Total Curent Liabilities 446,995 1,732,968 Long-Term Debt Plus: Deferred Revenue 2,818,423 20,476 14,007 58,189 Plus: Deferred Tax Liabilities 88,068 305.450 6,906,629 2,316,449 9,223,078 Plus: Other Long-Term Liabilities 211,179 4,871,114 3,319,573 8,190,687 Total Liabilities Total Stockholders' Equity Total Liabilities & Stockholders' Equity NII Holdings Historical Pro Forma Financial Data Exhibit 2A Historical Pro Forma Consolidated Income Statements for NII ($000's) Operating Results: Service Revenue 2011 2010 2012 5,066,404 227,387 5,293,791 1,404,555 656,409 3,232,827 5,465,120 278,002 5,743,122 1,574,327 829,859 3,338,936 6,081,577 299,240 6,380,817 1,681,692 784,072 3,915,053 Plus: Handset & Accessory Revenue Total Operating Revenue Less: Cost of Service (Excluding Depreciation & Amortization) Less: Cost of Handset Sales Gross Profit Less: Selling & Marketing 1,813,607 1,419,220 502,203 917,017 335,918 2,360,303 1,554,750 588,164 966,586 311,735 34,096 (37,297) 37,750 613,900 351,204 262,696 2,714,770 624,166 649,545 (25,379) 365,521 33,862 (53,957) 28,340 (439,335) 158,141 (597,476) EBITDA Less: Depreciation & Amortization Operating Income Less: Interest Expense Plus: Interest Income 28,334 52,412 18,686 643,159 269,869 373,290 Plus: Foreign Currency Gains Less: Other Expenses Earnings Before Taxes Less: Taxes Net Income Exhibit 3 Nextel Peru Historical Financial Data Historical Operating Results ($000's) Operating Results 2010 2011 2012 281,995 30,021 312,016 314,039 29,302 343,341 Service Revenue 321,942 32,187 354,129 107,710 71,857 174,562 Plus: Handset Revenue Total Operating Revenue Less: Cost of Services2 100,048 62,810 149,158 116,137 85,261 141,943 Less: Cost of Handset Sales Gross Profit Less: Selling & Marketing Expenses3 Less: General & Administrative Expenses Segment EBITDA 63,575 75,672 35,315 55,783 71,112 22,263 72,375 83,549 (13,981) Estimated Depreciation4 Total Assets 34,137 556,752 94,000 35,088 498,230 35,858 597,891 105,500 Capital Expenditures 77,700 69,642 Net Reinvestment in Long-Term Assets 59,863 42,612


