

Answered step by step
Verified Expert Solution
Question
1 Approved Answer
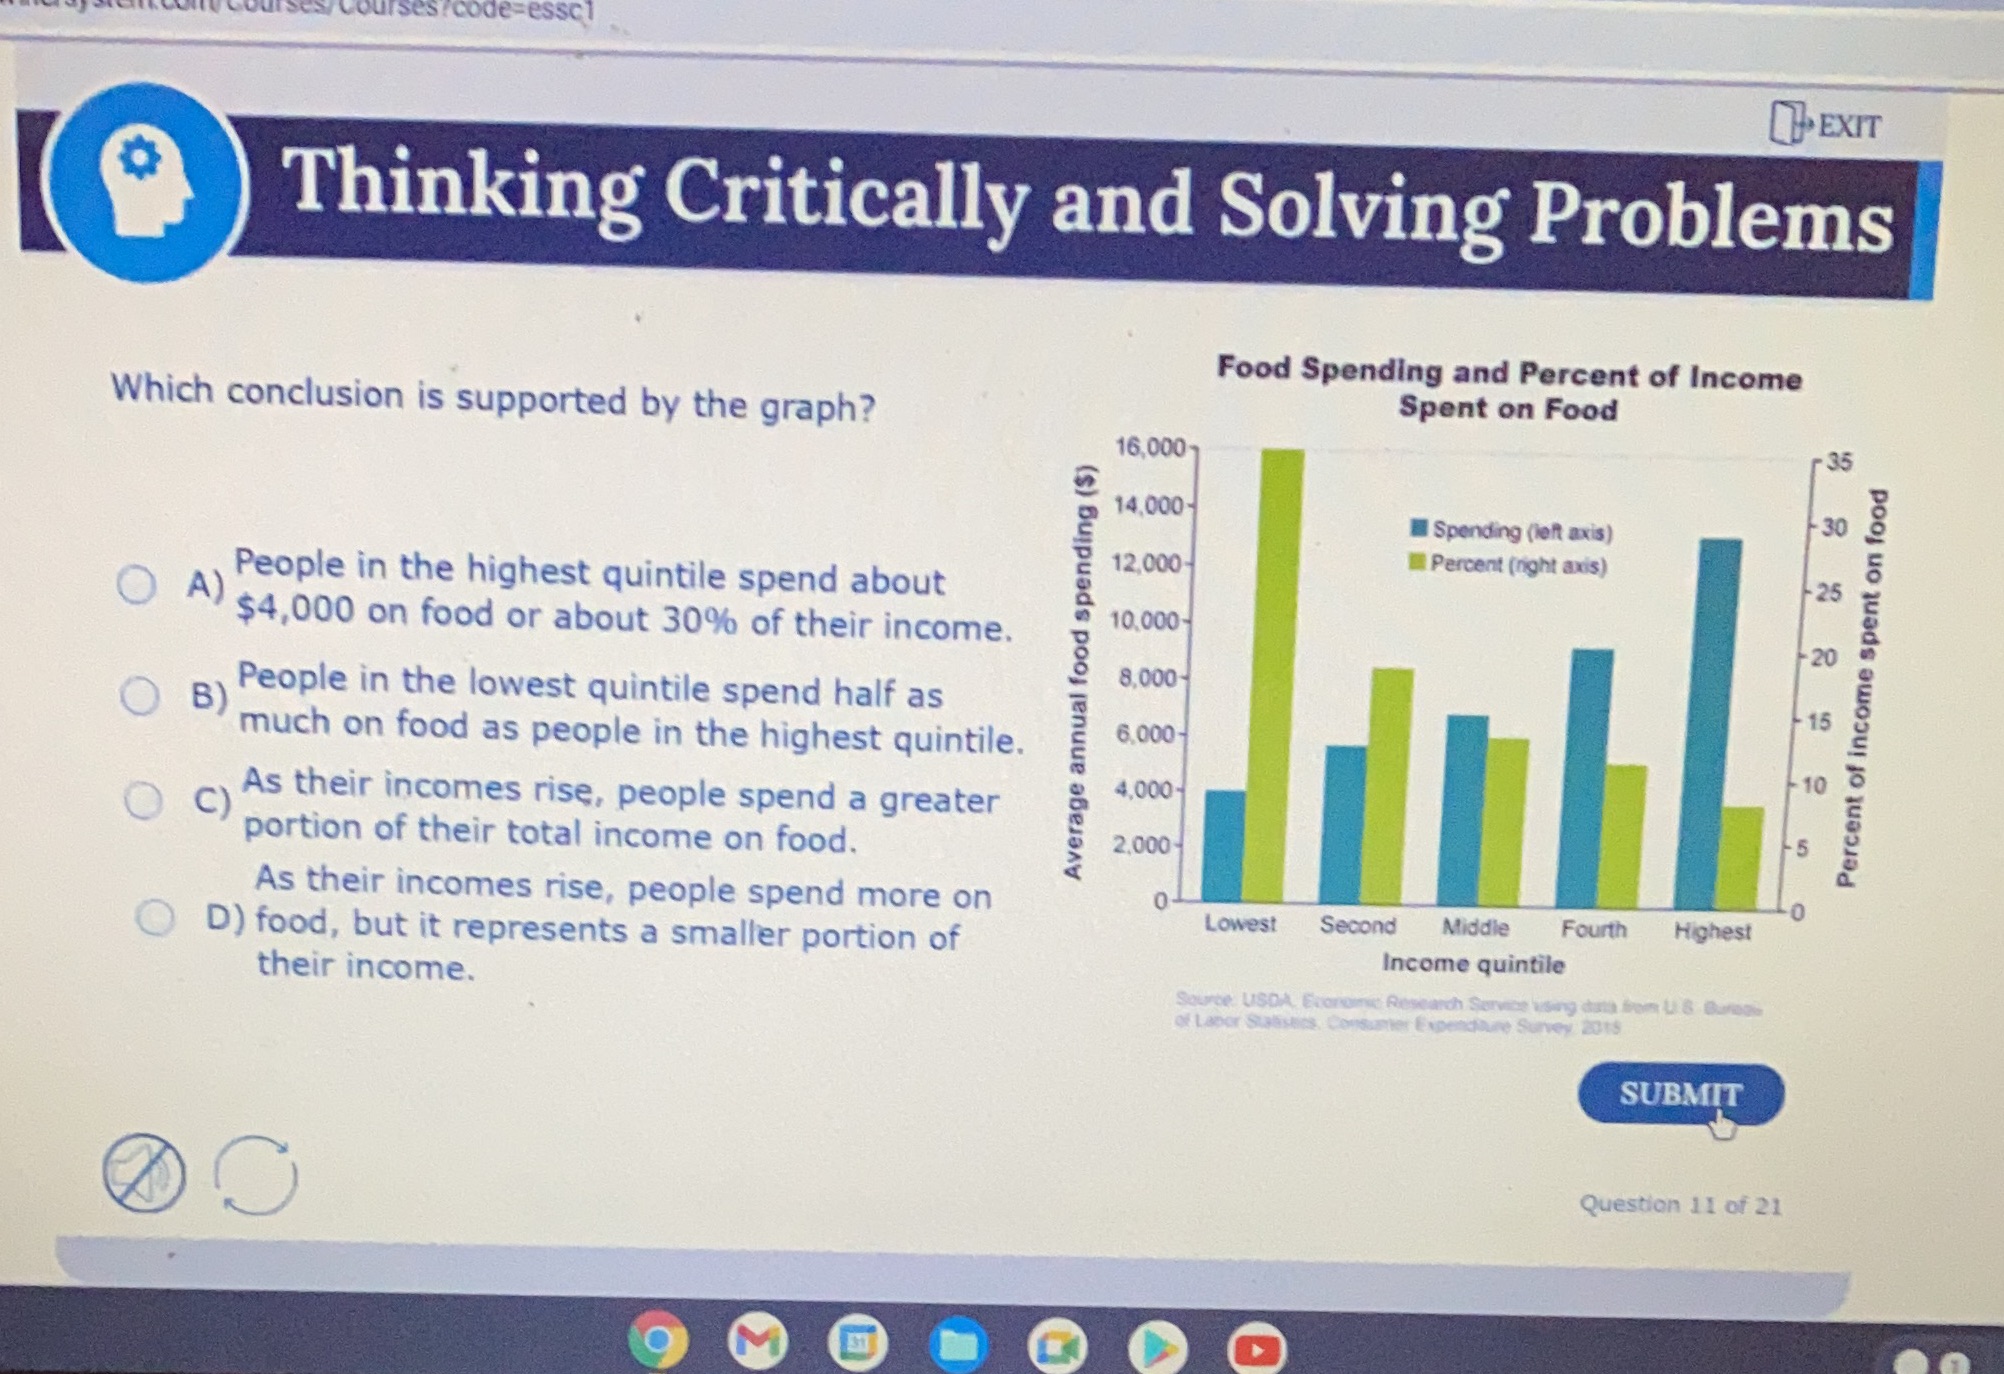
7. EXIT Thinking Critically and Solving Problems Food Spending and Percent of Income Which conclusion is supported by the graph? Spent on Food 16,000 35
Step by Step Solution
There are 3 Steps involved in it
Step: 1

Get Instant Access to Expert-Tailored Solutions
See step-by-step solutions with expert insights and AI powered tools for academic success
Step: 2

Step: 3
Ace Your Homework with AI
Get the answers you need in no time with our AI-driven, step-by-step assistance
Get Started
Accounting Principles Volume 2
Authors: Jerry J. Weygandt, Donald E. Kieso, Paul D. Kimmel, Barbara Trenholm, Valerie Warren, Lori Novak
8th Canadian Edition
1119502551, 1-119-50255-5, 978-1119502555