

Answered step by step
Verified Expert Solution
Question
1 Approved Answer
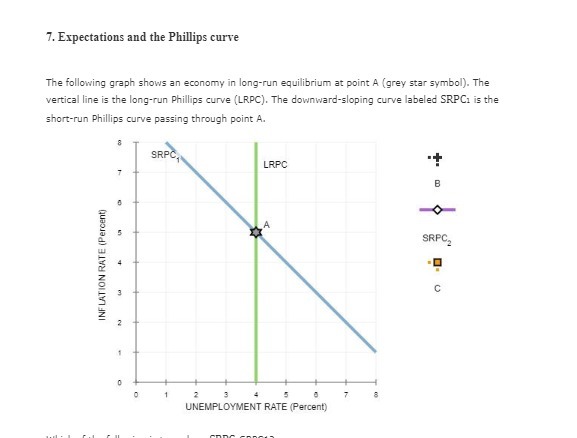
7. Expectations and the Phillips curve The following graph shows an economy in long-run equilibrium at point A (grey star symbol). The vertical line is
Step by Step Solution
There are 3 Steps involved in it
Step: 1

Get Instant Access to Expert-Tailored Solutions
See step-by-step solutions with expert insights and AI powered tools for academic success
Step: 2

Step: 3
Ace Your Homework with AI
Get the answers you need in no time with our AI-driven, step-by-step assistance
Get Started
Principles of economics
Authors: N. Gregory Mankiw
6th Edition
978-0538453059, 9781435462120, 538453052, 1435462122, 978-0538453042