7. Fiscal policy, the money market, and aggregate demand Consider a hypothetical economy in which households spend $0.50 of each additional dollar they earn and
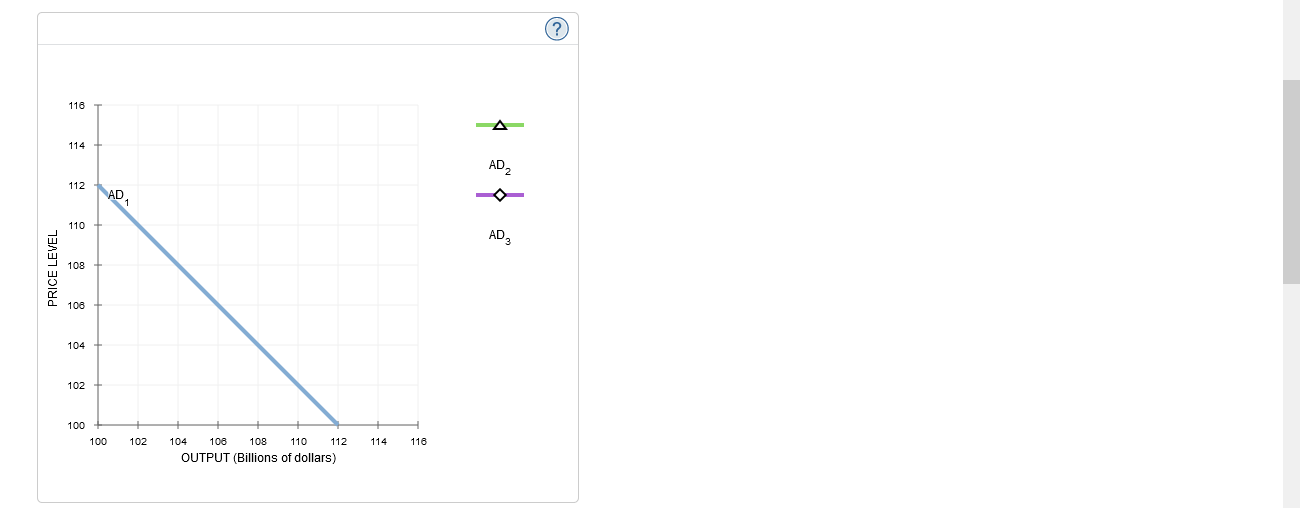
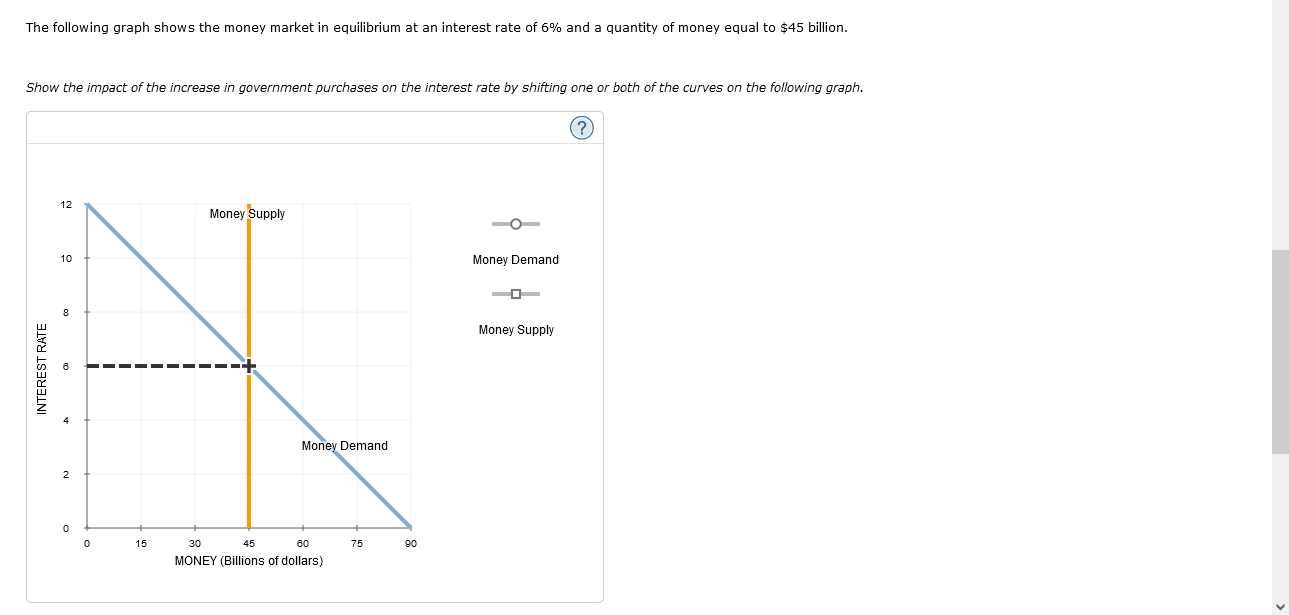
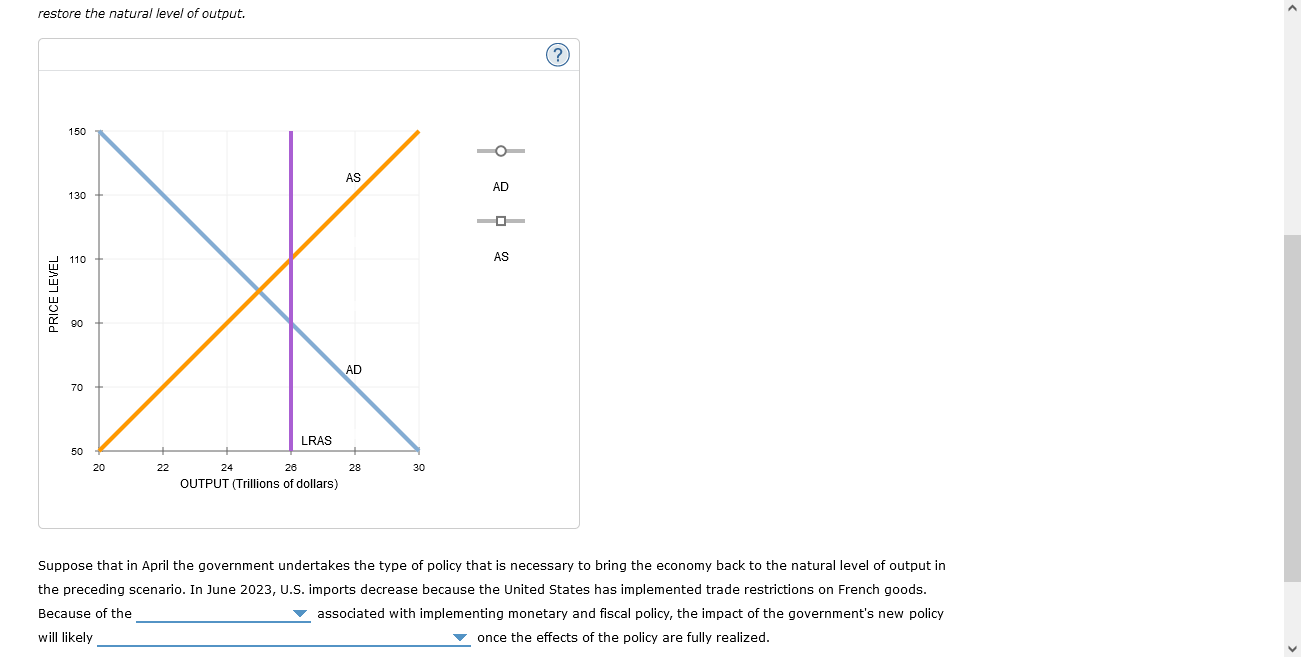
7. Fiscal policy, the money market, and aggregate demand Consider a hypothetical economy in which households spend $0.50 of each additional dollar they earn and save the remaining $0.50. The following graph shows the economy's initial aggregate demand curve (AD,). Suppose the government increases its purchases by $3 billion. Use the green line (triangle symbol) on the following graph to show the aggregate demand curve ( AD2) after the multiplier effect takes place. Hint: Be sure the new aggregate demand curve (AD,) is parallel to AD,. You can see the slope of AD, by selecting it on the following graph.? 116 A 114 AD 2 112 AD 110 AD 2 108 PRICE LEVEL 108 104 102 100 100 102 104 108 108 110 112 114 116 OUTPUT (Billions of dollars)The following graph shows the money market in equilibrium at an interest rate of 6% and a quantity of money equal to $45 billion. Show the impact of the increase in government purchases on the interest rate by shifting one or both of the curves on the following graph. 12 Money Supply O 10 Money Demand O Money Supply 8 INTEREST RATE 4 Money Demand 2 0 15 30 45 80 75 90 MONEY (Billions of dollars)Suppose that for each one-percentage-point increase in the interest rate, the level of investment spending declines by $0.5 billion. The change in the interest rate (according to the change you made to the money market in the previous scenario) therefore causes the level of investment spending to by After the multiplier effect is accounted for, the change in investment spending will cause the quantity of output demanded to by at each price level. The impact of an increase in government purchases on the interest rate and the level of investment spending is known as the effect. Use the purple line (diamond symbol) on the graph at the beginning of this problem to show the aggregate demand curve (AD,) after accounting for the impact of the increase in government purchases on the interest rate and the level of investment spending. Hint: Be sure your final aggregate demand curve (AD,) is parallel to AD, and AD2. You can see the slopes of AD, and AD, by selecting them on the graph.Back to Assignment Attempts Keep the Highest / 3 9. Use of discretionary policy to stabilize the economy Should the government use monetary and fiscal policy in an effort to stabilize the economy? The following questions address the issue of how monetary and fiscal policies affect the economy, and the pros and cons of using these tools to combat economic fluctuations. The following graph shows a hypothetical aggregate demand curve (AD), short-run aggregate supply curve (AS), and long-run aggregate supply curve (LRAS) for the U.S. economy in April 2023. Suppose the government decides to intervene to bring the economy back to the natural level of output by using policy. Depending on which curve is affected by the government policy, shift either the AS curve or the AD curve to reflect the change that would successfully restore the natural level of output.restore the natural level of output. (?) 150 O AS AD 130 110 AS PRICE LEVEL 90 AD 70 LRAS 50 20 22 24 26 28 30 OUTPUT (Trillions of dollars) Suppose that in April the government undertakes the type of policy that is necessary to bring the economy back to the natural level of output in the preceding scenario. In June 2023, U.S. imports decrease because the United States has implemented trade restrictions on French goods. Because of the associated with implementing monetary and fiscal policy, the impact of the government's new policy will likely once the effects of the policy are fully realized.10. Crowding out effect Suppose economists observe that an increase in government spending of $11 billion raises the total demand for goods and services by $44 billion. If these economists ignore the possibility of crowding out, they would estimate the marginal propensity to consume (MPC) to be Now suppose the economists allow for crowding out. Their new estimate of the MPC would be than their initial one
Step by Step Solution
There are 3 Steps involved in it
Step: 1
Get Instant Access to Expert-Tailored Solutions
See step-by-step solutions with expert insights and AI powered tools for academic success
Step: 2
Step: 3
Ace Your Homework with AI
Get the answers you need in no time with our AI-driven, step-by-step assistance