Answered step by step
Verified Expert Solution
Question
1 Approved Answer
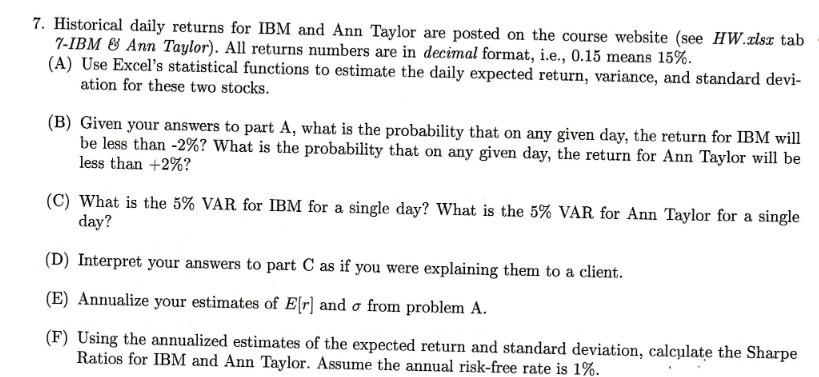
7. Historical daily returns for IBM and Ann Taylor are posted on the course website (see HW.xlsx tab 7-IBM & Ann Taylor). All returns

7. Historical daily returns for IBM and Ann Taylor are posted on the course website (see HW.xlsx tab 7-IBM & Ann Taylor). All returns numbers are in decimal format, i.e., 0.15 means 15%. (A) Use Excel's statistical functions to estimate the daily expected return, variance, and standard devi- ation for these two stocks. (B) Given your answers to part A, what is the probability that on any given day, the return for IBM will be less than -2%? What is the probability that on any given day, the return for Ann Taylor will be less than +2%? (C) What is the 5% VAR for IBM for a single day? What is the 5% VAR for Ann Taylor for a single day? (D) Interpret your answers to part C as if you were explaining them to a client. (E) Annualize your estimates of E[r] and from problem A. (F) Using the annualized estimates of the expected return and standard deviation, calculate the Sharpe Ratios for IBM and Ann Taylor. Assume the annual risk-free rate is 1%.
Step by Step Solution
There are 3 Steps involved in it
Step: 1
Answer A To estimate the daily expected return variance and standard deviation for IBM and Ann Taylor we can use Excels statistical functions 1 Open the Excel file containing the historical daily retu...
Get Instant Access to Expert-Tailored Solutions
See step-by-step solutions with expert insights and AI powered tools for academic success
Step: 2

Step: 3

Ace Your Homework with AI
Get the answers you need in no time with our AI-driven, step-by-step assistance
Get Started


