

Answered step by step
Verified Expert Solution
Question
1 Approved Answer
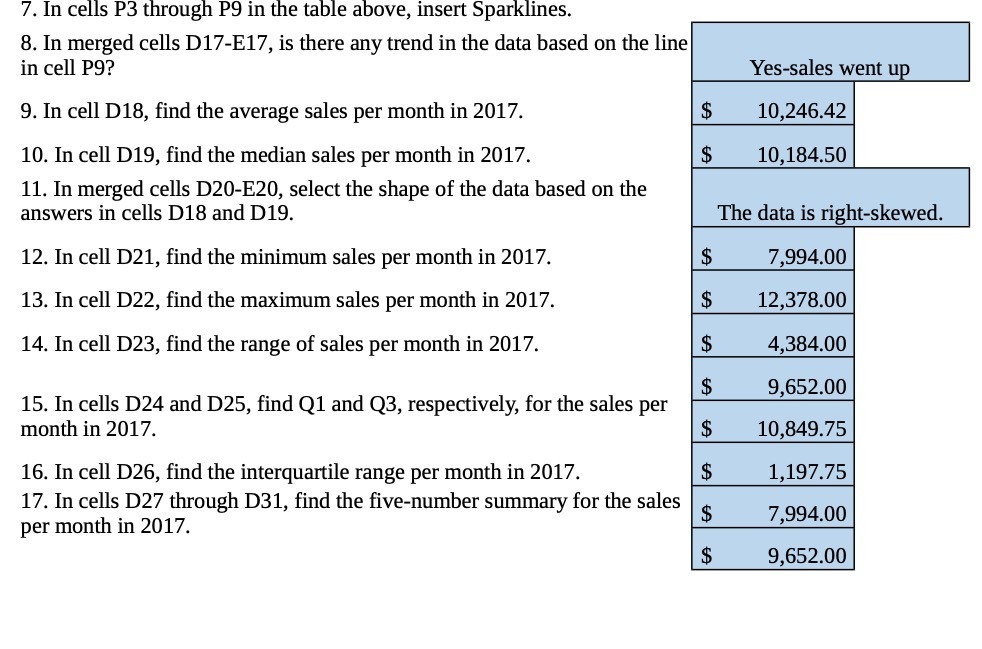
7. In cells P3 through P9 in the table above, insert Sparklines. B. In merged cells D17-E17, is there any trend in the data based
Step by Step Solution
There are 3 Steps involved in it
Step: 1

Get Instant Access to Expert-Tailored Solutions
See step-by-step solutions with expert insights and AI powered tools for academic success
Step: 2

Step: 3
Ace Your Homework with AI
Get the answers you need in no time with our AI-driven, step-by-step assistance
Get Started
Calculus
Authors: Dale Varberg, Edwin J. Purcell, Steven E. Rigdon
9th edition
131429248, 978-0131429246