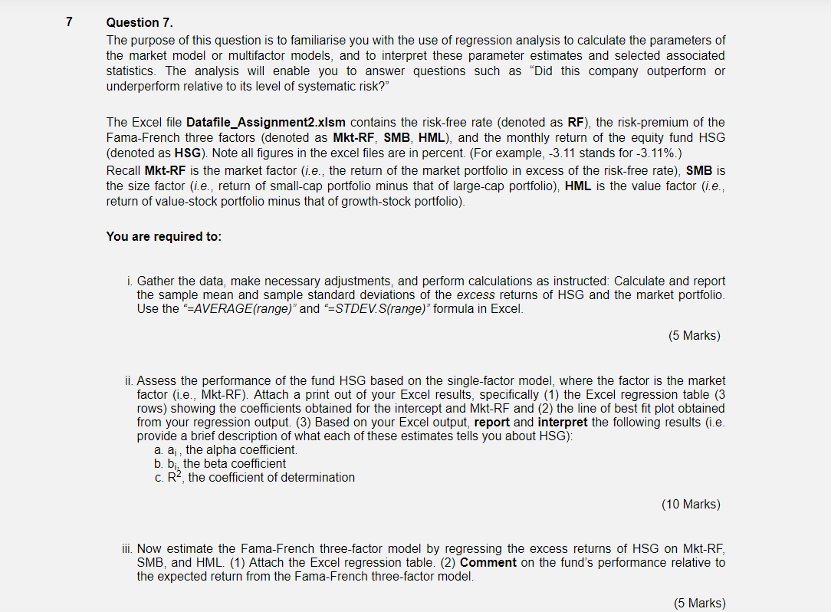

7 Question 7. The purpose of this question is to familiarise you with the use of regression analysis to calculate the parameters of the market model or multifactor models, and to interpret these parameter estimates and selected associated statistics. The analysis will enable you to answer questions such as "Did this company outperform or underperform relative to its level of systematic risk?" The Excel file Datafile_Assignment2.xlsm contains the risk-free rate (denoted as RF), the risk-premium of the Fama-French three factors (denoted as Mkt-RF, SMB, HML), and the monthly return of the equity fund HSG (denoted as HSG). Note all figures in the excel files are in percent. (For example, 3.11 stands for -3.11%) Recall Mkt-RF is the market factor (.e., the return of the market portfolio in excess of the risk-free rate), SMB is the size factor (.e., return of small-cap portfolio minus that of large-cap portfolio), HML is the value factor (i.e., return of value-stock portfolio minus that of growth-stock portfolio). You are required to: i. Gather the data, make necessary adjustments, and perform calculations as instructed: Calculate and report the sample mean and sample standard deviations of the excess returns of HSG and the market portfolio Use the '=AVERAGE(range)" and "STDEV. S(range)" formula in Excel. (5 Marks) ii. Assess the performance of the fund HSG based on the single-factor model, where the factor is the market factor (.e.. Mkt-RF). Attach a print out of your Excel results, specifically (1) the Excel regression table (3 rows) showing the coefficients obtained for the intercept and Mkt-RF and (2) the line of best fit plot obtained from your regression output (3) Based on your Excel output, report and interpret the following results (ie. provide a brief description of what each of these estimates tells you about HSG): aa, the alpha coefficient. b. bi the beta coefficient c. R2, the coefficient of determination (10 Marks) iii. Now estimate the Fama-French three-factor model by regressing the excess returns of HSG on Mkt-RF, SMB, and HML. (1) Attach the Excel regression table. (2) Comment on the fund's performance relative to the expected return from the Fama-French three-factor model. (5 Marks) iv. Compute a) HSG's Sharpe ratio, b) M2 measure, and c) Treynor measure based on the data and interpret the results. For all standard deviations in this part, use the sample standard deviations of the excess returns. Recall that Var(Ri - Rt) = Var(R) when the risk-free rate is constant. For expected excess return (risk premium), use the sample average of excess returns. (10 Marks) (Total for Question: 30 Marks) Ilse the Eycol 'Heln function if you need to 7 Question 7. The purpose of this question is to familiarise you with the use of regression analysis to calculate the parameters of the market model or multifactor models, and to interpret these parameter estimates and selected associated statistics. The analysis will enable you to answer questions such as "Did this company outperform or underperform relative to its level of systematic risk?" The Excel file Datafile_Assignment2.xlsm contains the risk-free rate (denoted as RF), the risk-premium of the Fama-French three factors (denoted as Mkt-RF, SMB, HML), and the monthly return of the equity fund HSG (denoted as HSG). Note all figures in the excel files are in percent. (For example, 3.11 stands for -3.11%) Recall Mkt-RF is the market factor (.e., the return of the market portfolio in excess of the risk-free rate), SMB is the size factor (.e., return of small-cap portfolio minus that of large-cap portfolio), HML is the value factor (i.e., return of value-stock portfolio minus that of growth-stock portfolio). You are required to: i. Gather the data, make necessary adjustments, and perform calculations as instructed: Calculate and report the sample mean and sample standard deviations of the excess returns of HSG and the market portfolio Use the '=AVERAGE(range)" and "STDEV. S(range)" formula in Excel. (5 Marks) ii. Assess the performance of the fund HSG based on the single-factor model, where the factor is the market factor (.e.. Mkt-RF). Attach a print out of your Excel results, specifically (1) the Excel regression table (3 rows) showing the coefficients obtained for the intercept and Mkt-RF and (2) the line of best fit plot obtained from your regression output (3) Based on your Excel output, report and interpret the following results (ie. provide a brief description of what each of these estimates tells you about HSG): aa, the alpha coefficient. b. bi the beta coefficient c. R2, the coefficient of determination (10 Marks) iii. Now estimate the Fama-French three-factor model by regressing the excess returns of HSG on Mkt-RF, SMB, and HML. (1) Attach the Excel regression table. (2) Comment on the fund's performance relative to the expected return from the Fama-French three-factor model. (5 Marks) iv. Compute a) HSG's Sharpe ratio, b) M2 measure, and c) Treynor measure based on the data and interpret the results. For all standard deviations in this part, use the sample standard deviations of the excess returns. Recall that Var(Ri - Rt) = Var(R) when the risk-free rate is constant. For expected excess return (risk premium), use the sample average of excess returns. (10 Marks) (Total for Question: 30 Marks) Ilse the Eycol 'Heln function if you need to


