

Question
7. Refer to Table 1. What is the correlation coefficient between the stock returns of A and B? A. 0.874. B. 0.934. C. 0.755. D.
7. Refer to Table 1.
What is the correlation coefficient between the stock returns of A and B?
A. 0.874. B. 0.934. C. 0.755. D. 0.652. E. None of the above.
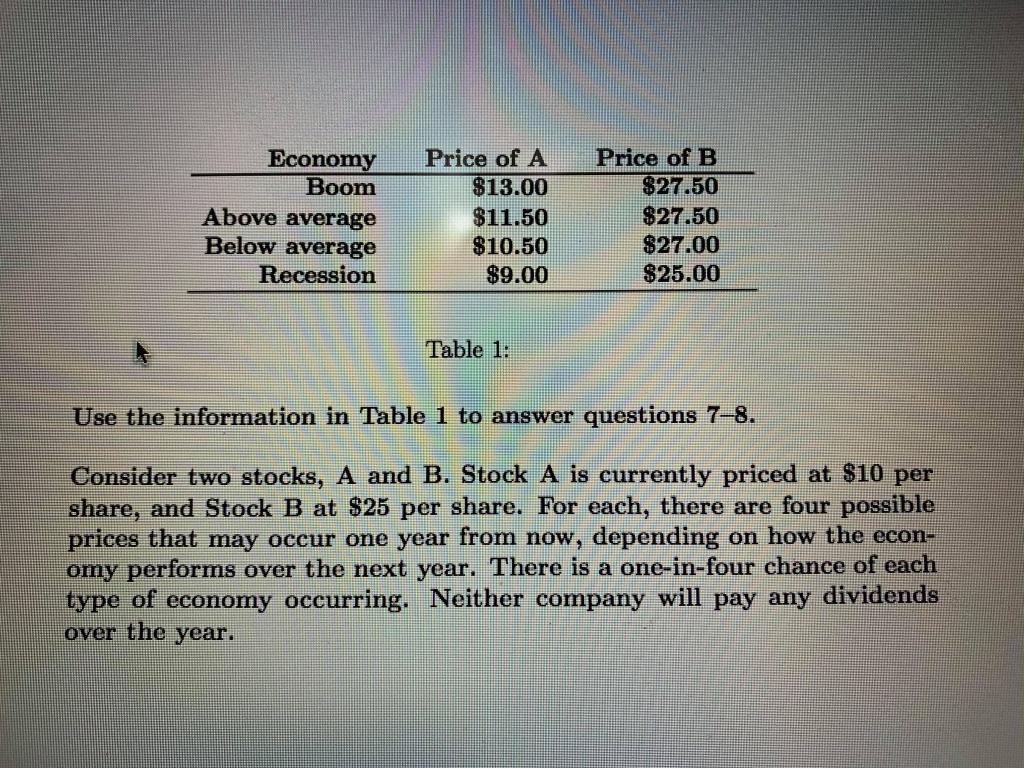
8. Refer to Table 1. If investors formed a portfolio with 60 percent of their money in Stock A and 40 percent in Stock B, what would be the expected return and standard deviation of the portflio?
A. (10.8%; 0.3044). B. (8.8%; 0.1022). C. (9.6%; 0.2241). D. (7.4%; 0.2893). E. None of the above.
Economy Boom Above average Below average Recession Price of A $13.00 $11.50 $10.50 $9.00 Price of B $27.50 $27.50 $27.00 $25.00 Table 1: Use the information in Table 1 to answer questions 78. Consider two stocks, A and B. Stock A is currently priced at $10 per share, and Stock B at $25 per share. For each, there are four possible prices that may occur one year from now, depending on how the econ- omy performs over the next year. There is a one-in-four chance of each type of economy occurring. Neither company will pay any dividends over the yearStep by Step Solution
There are 3 Steps involved in it
Step: 1

Get Instant Access to Expert-Tailored Solutions
See step-by-step solutions with expert insights and AI powered tools for academic success
Step: 2

Step: 3
Ace Your Homework with AI
Get the answers you need in no time with our AI-driven, step-by-step assistance
Get Started
The Handbook Of Mergers And Acquisitions
Authors: David Faulkner, Satu Teerikangas, Richard J. Joseph
1st Edition
0199601461, 978-0199601462