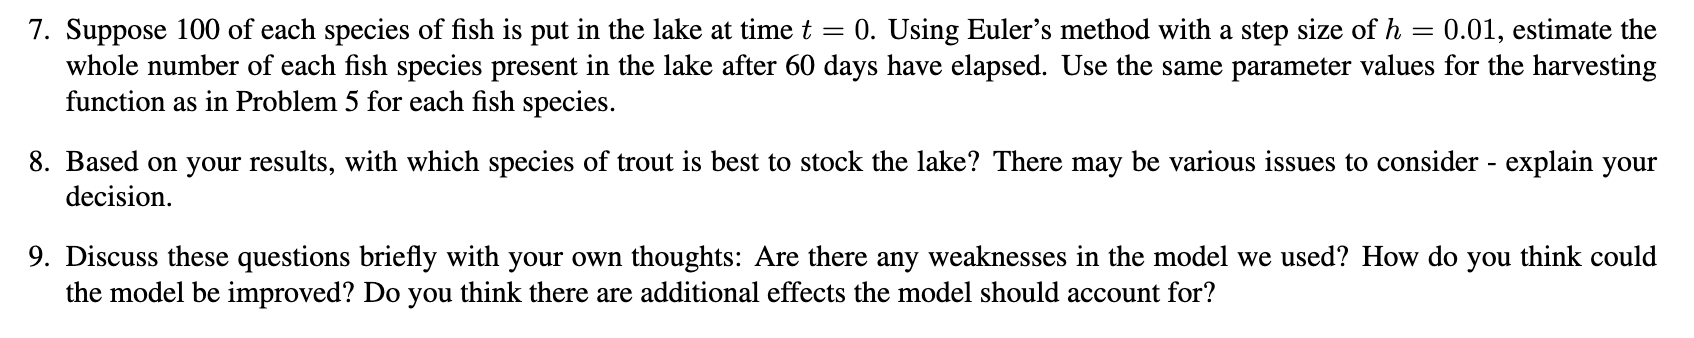
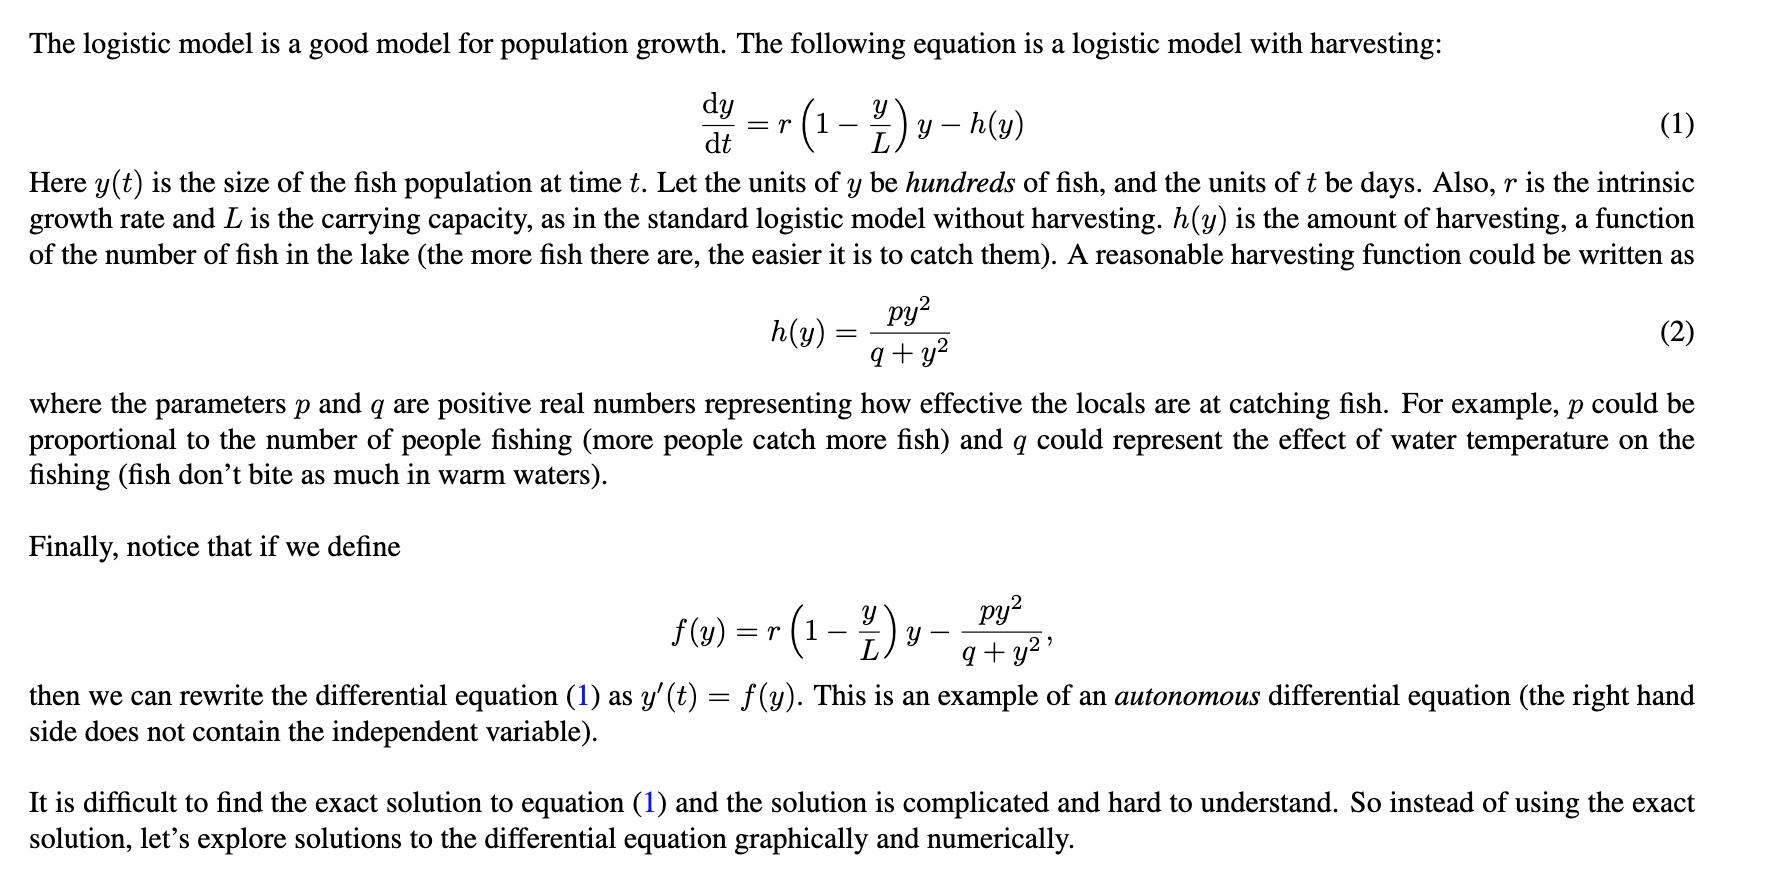
7. Suppose 100 of each species of sh is put in the lake at time t = 0. Using Euler's method with a step size of h = 0.01, estimate the whole number of each sh species present in the lake after 60 days have elapsed. Use the same parameter values for the harvesting function as in Problem 5 for each sh species. 8. Based on your results, with which species of trout is best to stock the lake? There may be various issues to consider - explain your decision. 9. Discuss these questions briey with your own thoughts: Are there any weaknesses in the model we used? How do you think could the model be improved? Do you think there are additional effects the model should account for? 5. Let p = 1.2 and q = 1 and suppose we put different types of trout in the lake. We assume that all the trout species have the same intrinsic growth rate r = 0.65 but the carrying capacities L are different for the different species. Rainbow trout have L = 5.4, brown trout have L = 8.1, and brook trout have L = 163. For the following graphs, be sure to include a title and label the axes. The logistic model is a good model for population growth. The following equation is a logistic model with harvesting: %=r(I%)yh(y) (1) Here y(t) is the size of the sh population at time t. Let the units of y be hundreds of sh, and the units of t be days. Also, 1' is the intrinsic growth rate and L is the carrying capacity, as in the standard logistic model without harvesting. My) is the amount of harvesting, a function of the number of sh in the lake (the more sh there are, the easier it is to catch them). A reasonable harvesting function could be written as 1292 q + y2 where the parameters 1) and q are positive real numbers representing how effective the locals are at catching sh. For example, 19 could be proportional to the number of people shing (more people catch more sh) and q could represent the effect of water temperature on the shing (sh don't bite as much in warm waters). My) = (2) Finally, notice that if we dene 2 f
=r(1%)yqpfy2, then we can rewrite the differential equation (1) as y' (t) = f (y). This is an example of an autonomous differential equation (the right hand side does not contain the independent variable). It is difcult to nd the exact solution to equation (1) and the solution is complicated and hard to understand. So instead of using the exact solution, let's explore solutions to the di'erential equation graphically and numerically