

Answered step by step
Verified Expert Solution
Question
1 Approved Answer
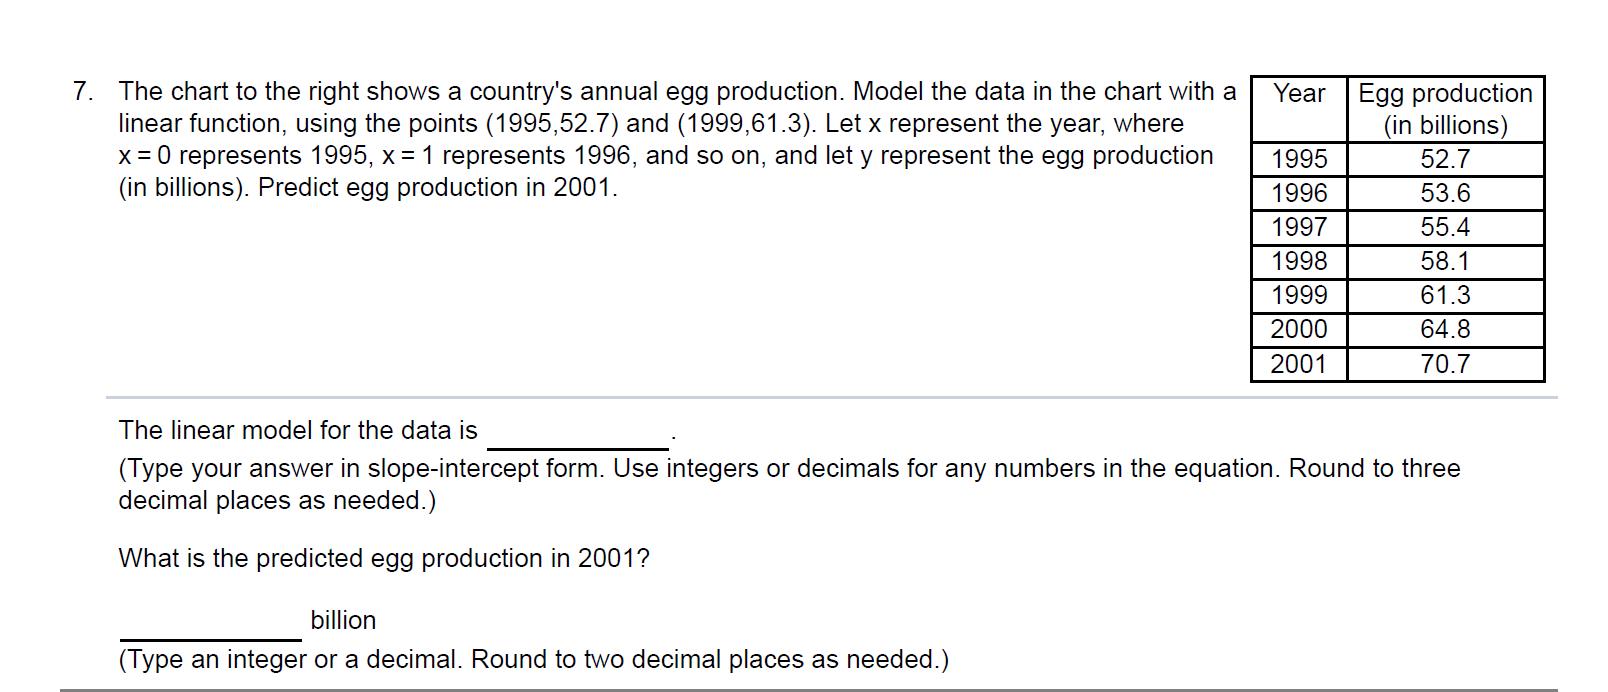
7. The chart to the right shows a country's annual egg production. Model the data in the chart with a Year Egg production linear function,
Step by Step Solution
There are 3 Steps involved in it
Step: 1

Get Instant Access to Expert-Tailored Solutions
See step-by-step solutions with expert insights and AI powered tools for academic success
Step: 2

Step: 3
Ace Your Homework with AI
Get the answers you need in no time with our AI-driven, step-by-step assistance
Get Started
Calculus Early Transcendentals
Authors: James Stewart
7th edition
538497904, 978-0538497909