Answered step by step
Verified Expert Solution
Question
1 Approved Answer
7. The following table gives information on the incomes (in thousands of dollars) and charitable contributions (in hundreds of dollars) for the past year for
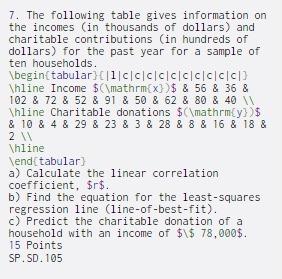
7. The following table gives information on the incomes (in thousands of dollars) and charitable contributions (in hundreds of dollars) for the past year for a sample of ten households. \begin{tabular}(|1|CCCCCCCCCC \hline Income $C\mathrm{x})$ & 56 & 36 & 102 & 72 & 52 & 91 & 50 & 62 & 80 & 40 W \hline Charitable donations $\mathrm{y})$ & 10 & 4 & 29 & 23 & 3 & 28 & 8 & 16 & 18 & 2 Vhline \end{tabular) a) Calculate the linear correlation coefficient, $r$. b) Find the equation for the least-squares regression line (line-of-best-fit). c) Predict the charitable donation of a household with an income of $1$ 78,000$. 15 Points SP.SD. 105
Step by Step Solution
There are 3 Steps involved in it
Step: 1
Get Instant Access to Expert-Tailored Solutions
See step-by-step solutions with expert insights and AI powered tools for academic success
Step: 2
Step: 3
Ace Your Homework with AI
Get the answers you need in no time with our AI-driven, step-by-step assistance
Get Started