7. The long-run effects of monetary policy The following graphs show the state of an economy that is currently in long-run equilibrium. The first graph
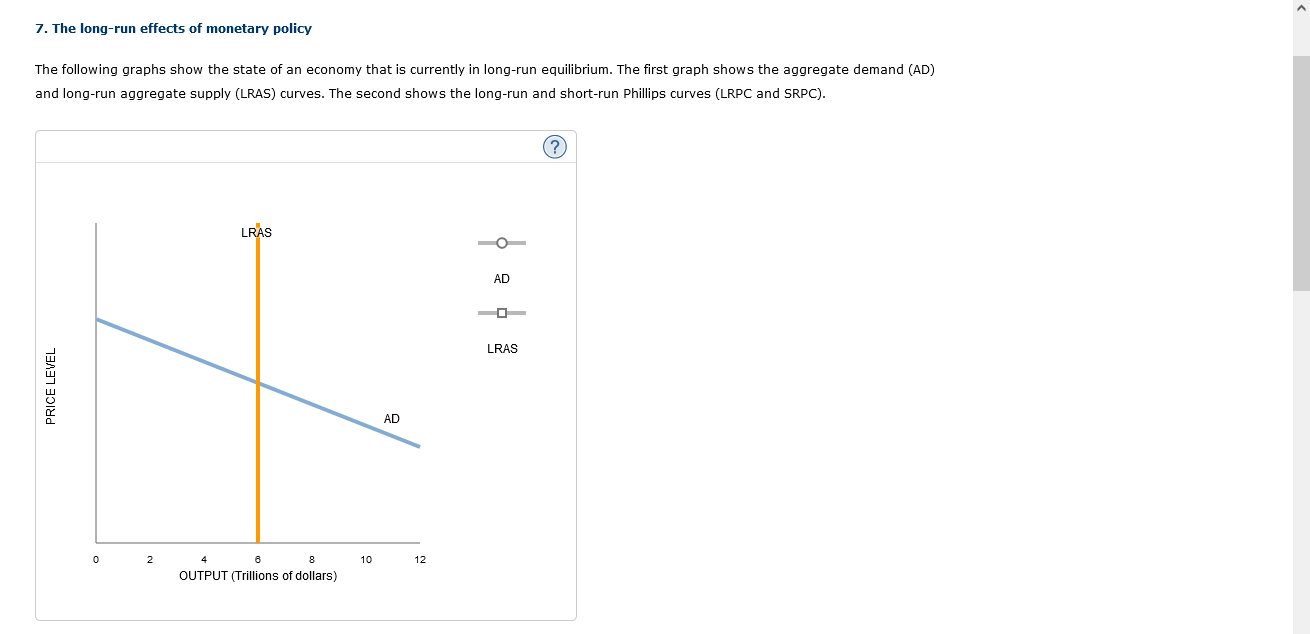
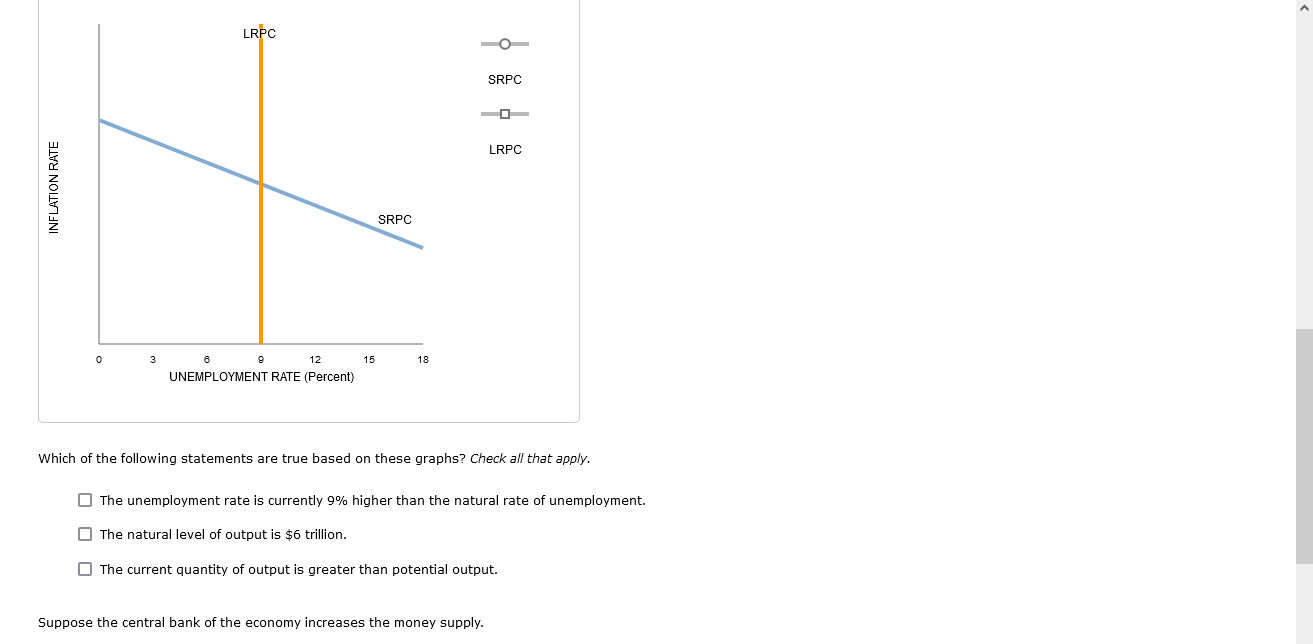
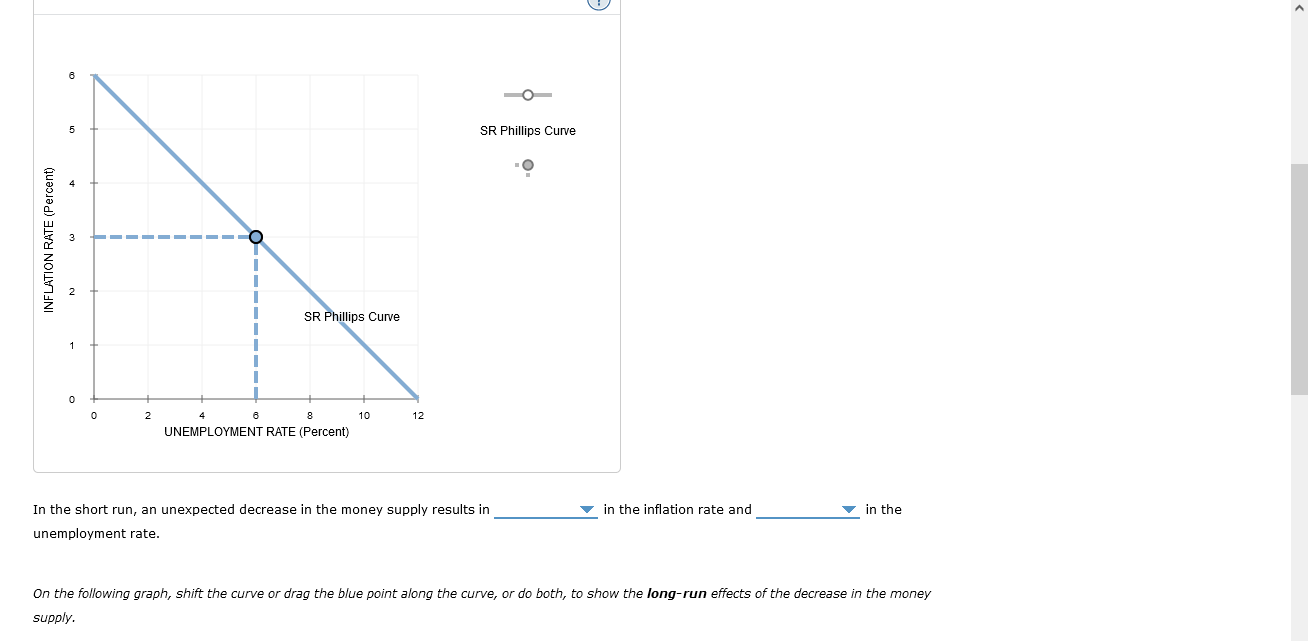
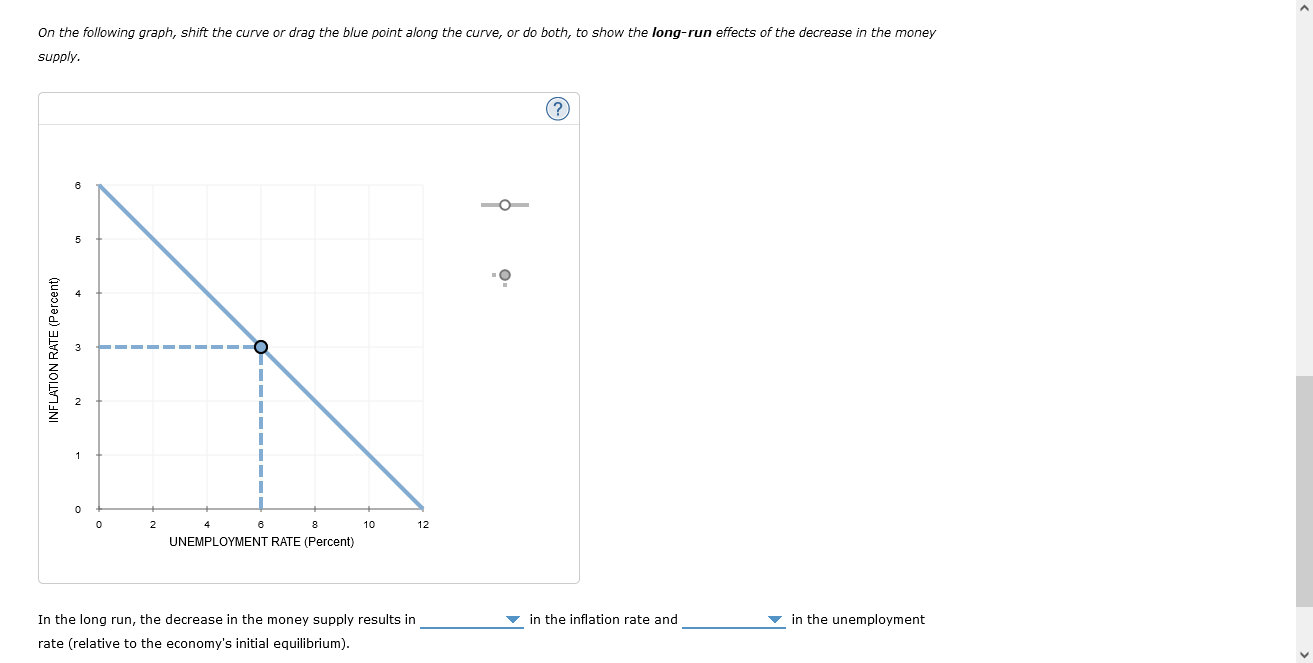
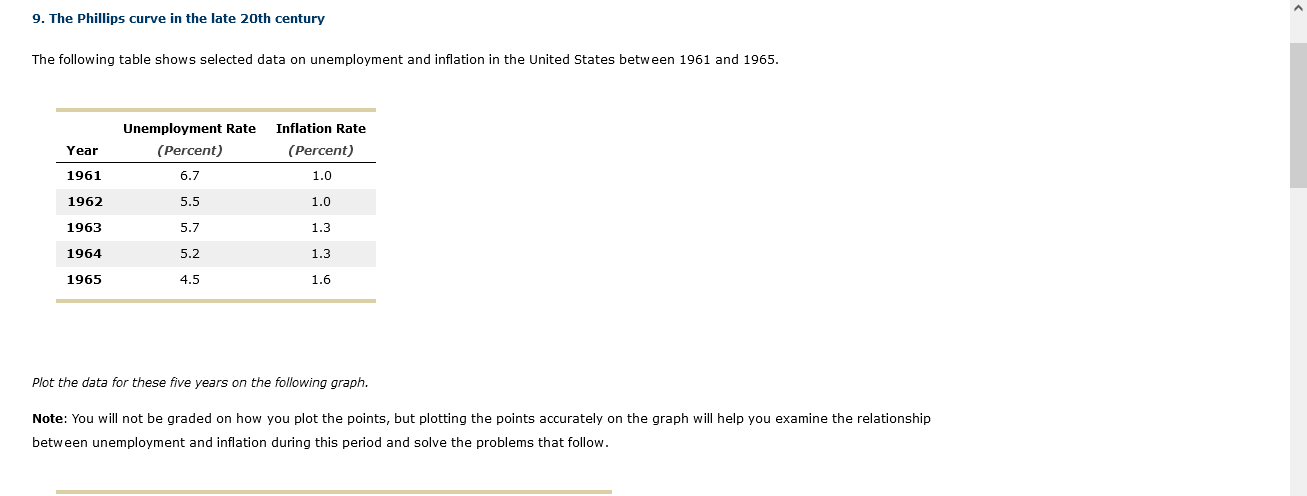
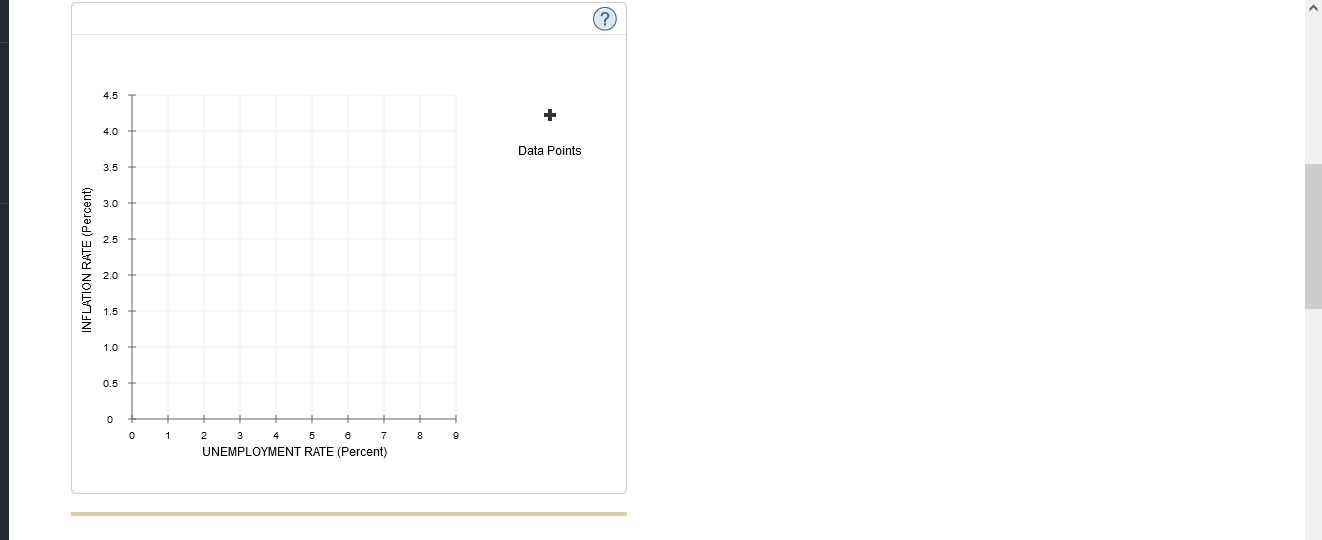
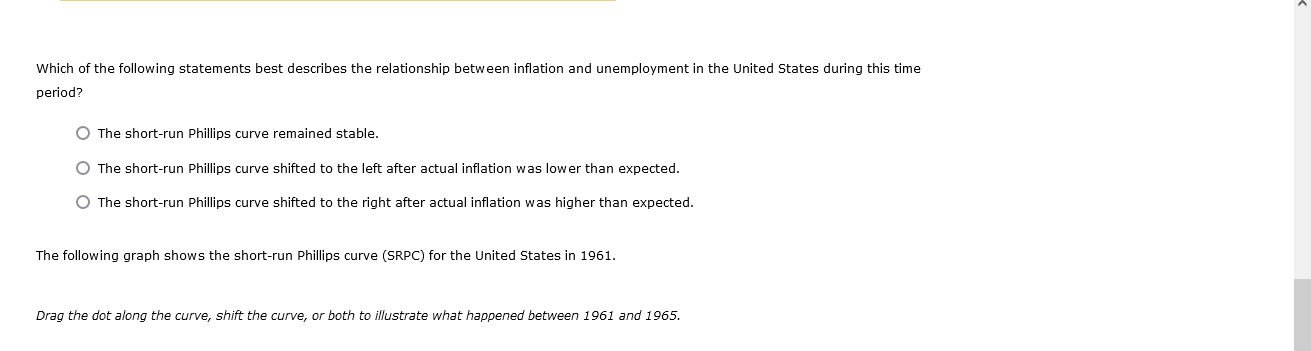
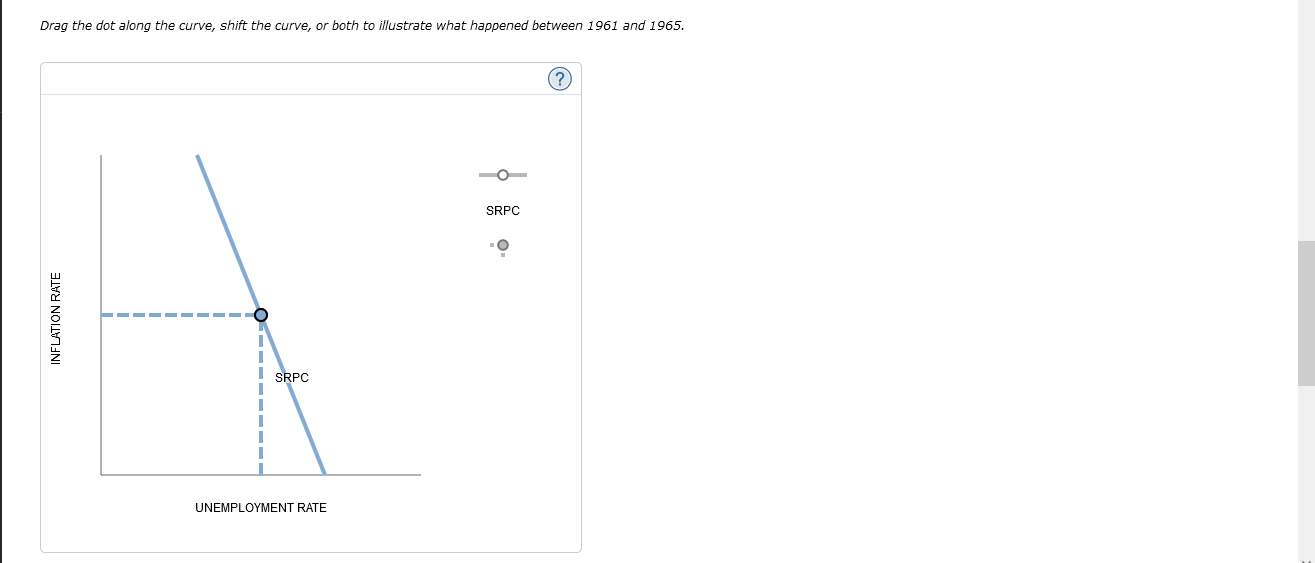
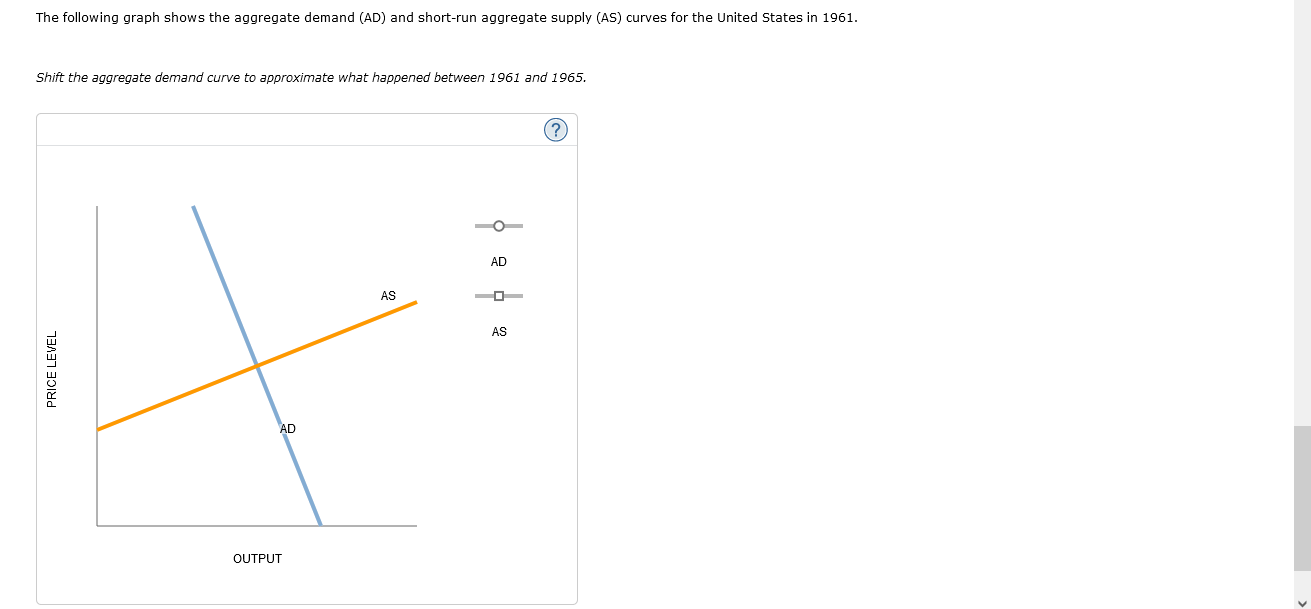
7. The long-run effects of monetary policy The following graphs show the state of an economy that is currently in long-run equilibrium. The first graph shows the aggregate demand (AD) and long-run aggregate supply (LRAS) curves. The second shows the long-run and short-run Phillips curves (LRPC and SRPC). LRAS O AD LRAS PRICE LEVEL AD 0 2 4 6 8 10 12 OUTPUT (Trillions of dollars)LRPC O SRPC O LRPC INFLATION RATE SRPC 3 9 12 15 18 UNEMPLOYMENT RATE (Percent) Which of the following statements are true based on these graphs? Check all that apply. O The unemployment rate is currently 9% higher than the natural rate of unemployment. O The natural level of output is $6 trillion. The current quantity of output is greater than potential output. Suppose the central bank of the economy increases the money supply.Show the long-run effects of this policy on both of the graphs by shifting the appropriate curves. The long-run effect of the central bank's policy is in the inflation rate, in the unemployment rate, and in real GDP.8. Monetary policy and the Phillips curve The following graph shows the current short-run Phillips curve for a hypothetical economy; the point on the graph shows the initial unemployment rate and inflation rate. Assume that the economy is currently in long-run equilibrium. Suppose the central bank of the hypothetical economy decides to decrease the money supply. On the following graph, shift the curve or drag the blue point along the curve, or do both, to show the short-run effects of this policy. Hint: You may assume that the central bank's move was unanticipated.O SR Phillips Curve 3 INFLATION RATE (Percent) 2 SR Phillips Curve 0 2 6 8 10 12 UNEMPLOYMENT RATE (Percent) In the short run, an unexpected decrease in the money supply results in in the inflation rate and in the unemployment rate. On the following graph, shift the curve or drag the blue point along the curve, or do both, to show the long-run effects of the decrease in the money supply.On the following graph, shift the curve or drag the blue point along the curve, or do both, to show the long-run effects of the decrease in the money supply. O INFLATION RATE (Percent) 3 O 2 0 2 6 10 12 UNEMPLOYMENT RATE (Percent) In the long run, the decrease in the money supply results in in the inflation rate and in the unemployment rate (relative to the economy's initial equilibrium).9. The Phillips curve in the late 20th century The following table shows selected data on unemployment and inflation in the United States between 1961 and 1965. Unemployment Rate Inflation Rate Year (Percent) (Percent) 1961 6.7 1.0 1962 5.5 1.0 1963 5.7 1.3 1964 5.2 1.3 1965 4.5 1.6 Plot the data for these five years on the following graph. Note: You will not be graded on how you plot the points, but plotting the points accurately on the graph will help you examine the relationship between unemployment and inflation during this period and solve the problems that follow.\fWhich of the following statements best describes the relationship between inflation and unemployment in the United States during this time period? O The short-run Phillips curve remained stable. O The short-run Phillips curve shifted to the left after actual inflation was lower than expected. O The short-run Phillips curve shifted to the right after actual inflation was higher than expected. The following graph shows the short-run Phillips curve (SRPC) for the United States in 1961. Drag the dot along the curve, shift the curve, or both to illustrate what happened between 1961 and 1965.Drag the dot along the curve, shift the curve, or both to illustrate what happened between 1961 and 1965. SRPC O INFLATION RATE SRPC UNEMPLOYMENT RATEThe following graph shows the aggregate demand (AD) and short-run aggregate supply (AS) curves for the United States in 1961. Shift the aggregate demand curve to approximate what happened between 1961 and 1965. O AD AS AS PRICE LEVEL AD OUTPUT
Step by Step Solution
There are 3 Steps involved in it
Step: 1
Get Instant Access to Expert-Tailored Solutions
See step-by-step solutions with expert insights and AI powered tools for academic success
Step: 2
Step: 3
Ace Your Homework with AI
Get the answers you need in no time with our AI-driven, step-by-step assistance